Zipf's Law Screensaver
Zipf's Law, Drawn is a free screensaver that plots real rankings, country populations, GDP, CO2 emissions and the largest French communes, by rank and size on log-log axes, beside the ideal 1/rank line. It computes the fitted slope by least squares, says where the rule holds and where it breaks, and ESC exits.
Live preview
Press ESC to leave fullscreen. Settings are saved in your browser only.
How the Zipf's Law, Drawn screensaver works
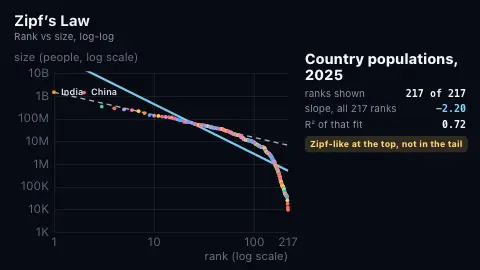
Rank a list from biggest to smallest. Zipf's rule of thumb says the item at rank r is about 1/r the size of the biggest, so on log-log axes size against rank should fall on a straight line of slope -1. The dashed white line on screen is exactly that ideal, anchored at the largest real value.
The points are real: the latest-year population, GDP and CO2 emissions of every country that reports them to the World Bank (content/wbtime.json), and the 25 largest French communes from the official geography API (content/frenchcommunes.json). They appear in rank order, evenly spaced along the log axis, so you see the head of the list first and the long tail last.
The blue line is an ordinary least-squares fit of log10(size) against log10(rank) through the points drawn so far, so its slope moves as they arrive. When all points are in, the panel gives the slope for every rank, for the top ranks alone and for the lower half, with the R-squared of the full fit. A fit depends heavily on which ranks you include, which is the point.
The verdict is computed from those slopes. A list is called close to Zipf only if the slope is within 0.12 of -1 and R-squared is at least 0.95; roughly Zipf-like if within 0.35 of -1 with R-squared at least 0.93; Zipf-like at the top if the top ranks fit near -1; otherwise it is called as not following it. Zipf's law is an empirical regularity, not a law of nature, and the screen says so.
Zipf and rank-size rules
The rule is named after linguist George Kingsley Zipf, who popularised the city-size pattern in a 1941 book and the word-frequency pattern in Human Behavior and the Principle of Least Effort (1949). Felix Auerbach had described the city pattern in 1913. Sources describe it as an empirical law that real data only approximates, and recent studies have questioned how well it fits city sizes (Wikipedia, "Zipf's law").
On log-log axes a power law shows up as a straight line, which makes it easy to see where a ranking departs from one: curves at the head usually reflect a few giants, and a collapse at the tail reflects a floor or ceiling on size. Fitting a line to the whole list can give a misleading single slope, which is why this saver shows several.
Population, GDP and CO2 are World Bank Open Data for the latest year reported; countries report on different schedules, so a few of the smallest may be a year earlier.
A worked example
In the 2025 World Bank figures used when this was written, India has 1,464 million people and China 1,407 million, a ratio of 1.04 where Zipf predicts 2. The fitted slope for the top 20 countries is -1.00, but a fit over all 217 has a slope of -2.20 with R-squared 0.72, and the lower half alone falls at about -8.9, because the smallest states are far smaller than 1/rank predicts. For the 25 largest French communes, Paris (2,103,778) is 2.37 times Marseille (886,040), and the slope is -0.77.
Settings & tips
- Dataset picks one list to hold on, or rotates through all of them.
- Speed sets how fast points arrive and how long each verdict stays up.
- Accent colour and Background restyle the plot.
- Press ESC to leave fullscreen.
Frequently asked questions
- Is Zipf's law a law of nature?
- No. It is an empirical regularity: some ranked lists, such as city sizes in some countries and word frequencies, come roughly close to size proportional to 1/rank over part of their range, and many do not. Nobody has an agreed explanation for why it appears when it does.
- Why do the countries fit at the top and not in the tail?
- The biggest countries follow the line fairly well, but below the top ranks the points fall far under it: the smallest countries are much smaller than 1/rank predicts. Countries are political units, so nothing forces the whole list onto one line.
- Why does the slope change while the points arrive?
- The slope shown is the least-squares fit to the points revealed so far. Early on it covers only the head of the list; by the end it covers everything, and the numbers can differ a lot.
- Why only 25 French communes?
- That is all the site's feed holds: the 25 largest by population from the official geography API. It shows only the head of the ranking and cannot say how the tail behaves. These are administrative communes, not urban areas, which matters for cities such as Paris.
- Is there a better city dataset?
- Probably, using urban areas rather than communes, and using a minimum-size cutoff as researchers do. This saver only uses data the site already holds and can verify.
- Where does the data come from?
- World Bank Open Data (population SP.POP.TOTL, GDP NY.GDP.MKTP.CD, CO2 EN.GHG.CO2.MT.CE.AR5), latest reported year, and geo.api.gouv.fr for the communes.