The Country Stat Wheel Screensaver
The Country Stat Wheel is a screensaver that shows one country's statistics one at a time — 21 measures from GDP and inflation to life expectancy and internet use — each with a history chart since 1960, the latest figure and its rank among every reporting country. You choose from 58 countries, or shuffle. It is free, key-less, and ESC exits.
Live preview
Press ESC to leave fullscreen. Settings are saved in your browser only.
How the The Country Stat Wheel screensaver works
The pipeline reads 21 World Bank indicators for every country, computes each country's rank on each one, and keeps full histories only for the 58 largest economies and populations you can choose from.
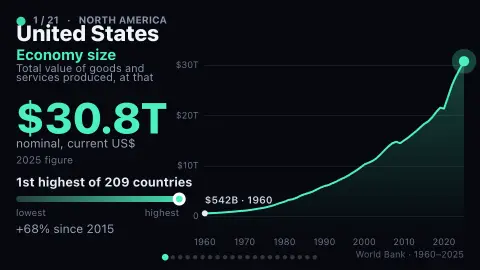
Each card counts the latest figure up, draws the history since 1960, and places a marker on a lowest-to-highest strip to show the rank.
A rank is given only when the country's latest value is within three years of the indicator's reference year, so it is compared with its contemporaries — and the card states which year the figure is from.
Where fewer than half of countries report a measure, such as central-government debt, a country outside the ranking says so rather than being given a made-up position.
Reading a country's indicator card
The World Bank’s World Development Indicators are its main compilation of cross-country comparable development data: about 1,400 time series covering 217 economies and more than 40 country groups, with many series going back over 50 years. The data is compiled from officially recognized national, regional and global sources, so each indicator carries a definition and a source note explaining exactly what is counted.
Cross-country comparison is harder than it looks. Reporting years differ, definitions of things like internet use or unemployment can vary between statistical offices, and some countries publish with a lag of a year or more. A figure labelled with a year is therefore the most recent one available for that country, not a measurement taken today, and two countries on the same card may be a year or two apart in their latest data.
Money-based indicators add another wrinkle: GDP and income can be shown in current dollars, constant dollars or adjusted for purchasing power, and each choice tells a different story. Rates such as inflation swing widely from year to year, while measures like life expectancy move slowly. The history chart is most useful for seeing the shape of change, and the rank for seeing roughly where a country sits, not for settling fine differences between neighbours.
A worked example
For the United States the first card reads $30.8 trillion — 1st highest of 209 countries — drawn over a history that climbs from $542 billion in 1960 and is up 68% since 2015.
Settings & tips
- Country picks from 58 places; Shuffle moves to a new one after every full turn.
- Speed sets how long each statistic stays up.
- Press ESC to leave fullscreen.
Frequently asked questions
- Which countries can I choose?
- The 58 with the largest economies or populations. Ranks, though, are worked out against every country that reports the measure.
- What does "1st highest of 209" mean?
- Of the 209 countries with a recent figure for that measure, this one has the highest. Highest is not always best: for unemployment or infant mortality it is the reverse.
- Why does a card sometimes say "not ranked"?
- The country's latest figure is more than three years older than the indicator's reference year, so ranking it against newer figures would not be fair.
- Where is the data from?
- The World Bank's World Development Indicators, an open and key-less source.
- Why do some countries have older latest figures than others?
- Data are compiled from national and international sources that publish on different schedules, and a year can only appear once it has been reported. Some countries lag by several years.
- Are the rankings comparable between indicators?
- Only loosely. Each rank is relative to the countries that reported that particular measure, so a first place out of a few dozen is not the same kind of statement as first out of two hundred.
- Why do some history lines have gaps or jumps?
- Years without data are simply missing, and series can change when definitions or methods change. A sudden step is sometimes a methodology change rather than a real overnight shift.