The GDP Race Screensaver
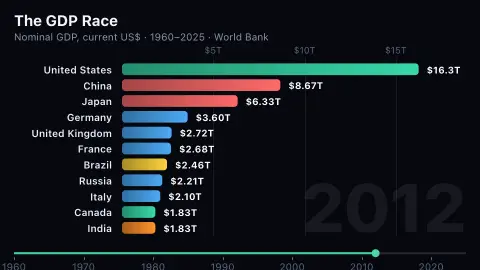
The GDP Race is a bar chart race screensaver that ranks every country's economy from 1960 to the latest World Bank year, re-ordering the bars as economies overtake one another. It uses World Bank GDP in current US dollars, is free, needs no key, runs in your browser, and ESC exits.
Live preview
Press ESC to leave fullscreen. Settings are saved in your browser only.
How the The GDP Race screensaver works
A build step reads the World Bank's GDP series for every country and packs it into one small file, so the saver starts at once instead of downloading several megabytes of raw API output.
Between each pair of years the bars are interpolated and then re-ranked, so a country that passes another slides past it rather than jumping. The axis follows the leader upward and eases back down when the lead changes hands.
Whenever two economies in the leading group swap places the chart says so — Japan passes Germany in 1968, China passes Germany in 2007, China passes Japan in 2010.
A country appears when the World Bank begins publishing it, so the Soviet Union is absent and Russia enters in 1988. Figures are nominal US dollars at each year's exchange rate, so the bars rise with inflation as well as growth.
Reading GDP in current US dollars
Gross domestic product is the total income earned through the production of goods and services in an economy. The World Bank's series is compiled from country official statistics, national statistical organisations and central banks, with national accounts data from the OECD and World Bank staff estimates. Its series in current US dollars is expressed in current prices, not adjusted for inflation, and converted into US dollars, which makes countries comparable on one axis but also makes them sensitive to currency swings.
That choice matters for how the race looks. A country's bar can jump or shrink in dollar terms because its currency strengthened or collapsed, even if its real output barely changed. With no adjustment for inflation, a bar from the 1960s and one from today sit on different yardsticks, so the steady growth of the whole chart is partly just money getting cheaper.
Overtakes are therefore best read as shifts in dollar-denominated size rather than verdicts on living standards. GDP says nothing about how income is shared, about unpaid work, or about population; a large economy is not necessarily a rich one per person. Recent years can also be revised as statisticians fill in late data.
A worked example
In 1960 the United States' economy is $542 billion — more than six times Germany's $85 billion, which is next. By 2010 China ($6.19 trillion) has passed Japan ($5.81 trillion) for second place, and by 2025 the United States stands at $30.8 trillion with China at $19.5 trillion.
Settings & tips
- Countries shown sets how many bars race at once, from 6 to 20.
- Start year skips the early decades, and Speed sets how quickly the years pass.
- Press ESC to leave fullscreen.
Frequently asked questions
- Is the GDP adjusted for inflation?
- No. It is World Bank GDP in current US dollars: each year's output converted at that year's exchange rate. It is the figure headlines quote, and it means a currency collapse can look like an economy shrinking.
- Why is there no Soviet Union or Yugoslavia?
- The World Bank publishes a series for each country in its current list, from the first year it has data. Russia's begins in 1988; states that no longer exist are not shown as such.
- Is this live data?
- It is the World Bank's published annual series, refreshed whenever the site's data pipeline runs. The Bank itself revises it a few times a year, so it is current but not a live feed.
- Does it need an API key?
- No. The World Bank's open data API is key-less, and the saver reads a packed copy from this site.
- Why not rank countries by GDP per person instead?
- A total-GDP race shows the size of each economy, which is what this series records directly. Per-person rankings would reorder the chart heavily, putting small wealthy states ahead of large ones.
- Why do some bars lurch suddenly in a single year?
- Because figures are converted into US dollars, a sharp currency devaluation or revaluation can move a country's dollar GDP at once, even if its output barely changed.
- Do the figures change after they are published?
- They can. National statistical offices revise their estimates, so recent years in particular may shift between releases.