Wealth, Health and Headcount Screensaver
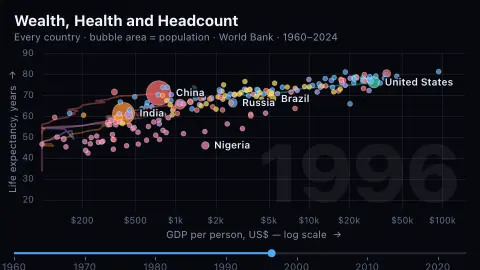
Wealth, Health and Headcount is an animated bubble chart screensaver: GDP per person across, life expectancy up, bubble area for population, one bubble per country from 1960 to the latest World Bank year. It follows the format Hans Rosling popularised. It is free, key-less and runs in your browser.
Live preview
Press ESC to leave fullscreen. Settings are saved in your browser only.
How the Wealth, Health and Headcount screensaver works
Three World Bank series — GDP per person, life expectancy and population — are packed into one file, and each country is drawn only in years when it has all three.
Income is on a logarithmic scale, because a tenfold difference in income matters as much at $500 as at $50,000. Positions are interpolated geometrically between years so the motion is smooth.
The five most populous countries leave trails, so you can follow China's long climb across the page.
Sharp drops are called out only from a short list of historically settled events — Rwanda 1994, Cambodia 1975, Haiti 2010 — and only when the data actually dips in that year. Picking the biggest falls automatically was rejected because a few fragile states' series swing by decades in ways that look like estimation artefacts.
The Rosling bubble chart and its message
The format used here was made famous by Hans Rosling, a Swedish physician and professor of international health at the Karolinska Institute. In 2005 he co-founded the Gapminder Foundation with his son Ola Rosling and daughter-in-law Anna Rosling Rönnlund. Its animated bubble-chart software, Trendalyzer, was acquired by Google in 2006. Gapminder’s stated aim is to fight ignorance with fact-based worldviews, and Rosling used these charts to show how far countries’ incomes and life expectancies had moved over the decades.
Each bubble is a country. Its horizontal position is income per person, its height is how long people live on average, and its size is how many people live there. Life expectancy at birth is usually a period measure: the average lifespan of a hypothetical group exposed to the death rates seen in a given year. It is highly sensitive to deaths in the first few years of life, so a rise often reflects fewer early deaths. Income is GDP divided by population, an average that says nothing about how it is shared.
Wealthier countries tend to have longer-living populations, but that is a correlation with large exceptions in both directions. Dips can mark wars, epidemics or famines, though data revisions and gaps also create jumps. The set of countries is whichever ones the World Bank reports.
A worked example
In 1960 the chart can place 110 countries; by 2023 it places 204. In 1994 Rwanda's bubble falls from 42.9 years of life expectancy to 12.2 in a single year, and in 1975 Cambodia's falls from 39.3 to 12.8 — the two deepest drops among the documented events it marks.
Settings & tips
- Speed sets how quickly the years pass.
- Bubble area is population; colour is the World Bank region.
- Press ESC to leave fullscreen.
Frequently asked questions
- Why is the income axis logarithmic?
- Because incomes span more than a thousandfold. On a linear scale nearly every country would be crushed against the left edge.
- Why do some bubbles drop so sharply?
- Life expectancy in a single year includes that year's deaths from war, famine and disaster, so a catastrophe can pull it down by decades. The chart labels a handful of well-documented cases.
- Is GDP per person adjusted for prices?
- No. It is in current US dollars at each year's exchange rate, so it moves with currencies and inflation as well as with output.
- Why are there fewer bubbles in 1960?
- A country is drawn only when the World Bank has all three figures for it that year. Coverage grows from 110 countries in 1960 to over 200 by the 2000s.
- What does life expectancy at birth actually mean?
- It is the average number of years a newborn would live if the death rates observed in a given year applied throughout life. It is not a prediction for any individual.
- Does GDP per person show how rich ordinary people are?
- Only roughly. It is an average, so it can be pulled up by a small group at the top, and it says nothing about how income is shared.
- Who was Hans Rosling?
- A Swedish physician and professor of international health at the Karolinska Institute. He co-founded the Gapminder Foundation and became known for presenting global statistics with animated charts.