The Population Race Screensaver
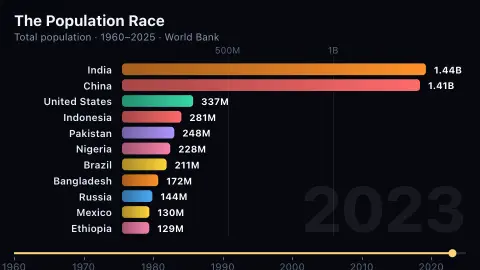
The Population Race is a bar chart race screensaver that ranks every country by total population from 1960 to the latest World Bank year. On the World Bank's series India overtakes China for first place in 2021. It is free, key-less, runs in your browser, and ESC exits.
Live preview
Press ESC to leave fullscreen. Settings are saved in your browser only.
How the The Population Race screensaver works
The World Bank's total-population series for every country is packed into one small file by the site's data pipeline, and the saver draws straight from it.
Each year's figures are interpolated to the next, ranked, and drawn as bars that slide past each other as the order changes; the scale re-fits itself as the leader grows.
When the top places swap, a short note names the pair and the month-less year — the chart only announces passes among the leading group, so it stays quiet when small countries trade places far down the list.
Bars are coloured by World Bank region, so the shift in where the people are — Asia and then Africa gaining on everyone else — shows as a change in colour as well as in length.
How population gets counted worldwide
A country’s population is usually established by a census, a full count taken roughly every ten years, and updated in between using birth, death and migration records or surveys. The World Bank does not run its own counts. Its total-population series draws on the UN Population Division’s World Population Prospects, national statistical offices, Eurostat and the UN Statistics Division’s Population and Vital Statistics Report.
The Bank’s total population is based on the de facto definition, which counts all residents regardless of legal status or citizenship, and the values are midyear estimates. That common series is what makes a race possible, but it hides the messiness behind it. Some countries have not held a census in a long time, so their figures rest on estimates. Borders change, with new states appearing and old ones dissolving, which can make some bars arrive part-way through the timeline.
Migrant workers, refugees and disputed territories raise further counting questions. Projections are uncertain, and the order of the largest countries depends on the dataset and the revision used, so the same race drawn from another source can differ in detail.
A worked example
In 1960 China has 667 million people, India 436 million and the United States 181 million. By 2024 India has 1.45 billion, China 1.41 billion and the United States 340 million: the two largest have swapped places, and the next country is less than a quarter of their size.
Settings & tips
- Countries shown goes from 6 to 20 bars.
- Start year lets you skip straight to the recent decades.
- Press ESC to leave fullscreen.
Frequently asked questions
- Where do the population figures come from?
- The World Bank's total-population indicator, which it compiles from national census figures and United Nations Population Division estimates. It counts all residents regardless of legal status.
- Does the chart say when India passed China?
- Yes, from the data: on the World Bank's series the order of the top two changes in 2021. Other agencies' estimates date the crossover differently, because population counts for both countries are themselves estimates.
- Why do some countries appear partway through?
- A country enters when the World Bank starts publishing a series for it. For population almost every country is there from 1960, so late arrivals are rare.
- Is it free and key-less?
- Yes. It needs no account or API key and runs entirely in your browser.
- Why can two sources give different population numbers?
- They may use different reference dates, definitions of residence or estimation methods, and revisions arrive when new data are published. The World Bank series, for example, uses a de facto definition and midyear estimates.
- Does the chart include territories and city-states?
- It includes the economies the World Bank reports in its population series, which covers many small territories and city-states, though tiny ones sit far down the ranking.