World Population Growth Board Screensaver
The World Population Growth Board screensaver ranks countries by real annual population growth rate, from published UN demographic estimates. It is free, runs in your browser, and ESC exits.
Live preview
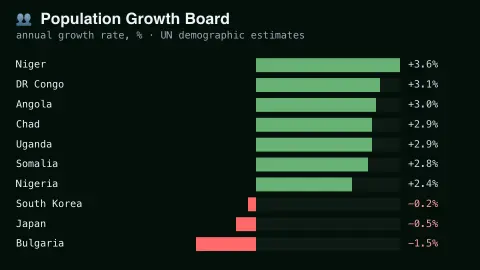
Press ESC to leave fullscreen. Settings are saved in your browser only.
How the World Population Growth Board screensaver works
The saver displays a real, curated ranking of countries by their published annual population growth rate.
Each country shows its real reported growth rate, as a percentage.
The board refreshes periodically as new real UN demographic estimates are published.
No live feed is required — figures are a real, curated periodic snapshot.
Reading annual population growth rates
Population growth is the net result of births, deaths and migration. The annual rate is the percentage by which a country’s population changes in a year, and country comparisons like this one usually draw on estimates compiled by the United Nations Population Division. Its World Population Prospects series is the official UN set of population estimates and projections; the 2024 Revision, the twenty-eighth edition, covers 237 countries or areas from 1950 onward, with projections to 2100.
A growth rate tells you about proportional change, not size. Because it is a percentage, a small nation can post a faster rate than a populous one, so the top of a growth ranking is often a mix of very different cases. A rate of two per cent a year, if sustained, would double a population in roughly thirty-five years, and the rule of thumb is to divide seventy by the rate in per cent.
The estimates behind the rates draw on national population censuses, vital registration data and surveys. The 2024 Revision alone draws on 1,910 censuses conducted between 1950 and 2023. Newer editions can revise earlier figures as new data arrive, so the numbers give a broad comparison between countries rather than a precise count for any one year.
A worked example
A country with a real high birth rate and young population shows a notably higher real growth rate than an aging, low-birth-rate nation.
Settings & tips
- Accent recolours the ranking bars.
- Figures are real, published UN demographic estimates.
- Some countries show real negative growth from declining birth rates.
Frequently asked questions
- Is this real demographic data?
- Yes — real published UN population growth rate estimates.
- Is a key needed?
- No — figures are a curated real periodic snapshot.
- Can growth be negative?
- Yes — some real countries show population decline due to low birth rates.
- Is it free?
- Yes — free, no download, in your browser.
- Why do small countries often appear at the extremes?
- A growth rate is a percentage, so a modest absolute change is a large share of a small population.
- How long would a country take to double at a given rate?
- A rule of thumb is to divide seventy by the growth rate in per cent, so two per cent suggests about thirty-five years, if the rate stayed constant.
- Are these figures exact?
- No. They are demographic estimates compiled from censuses, registration data and surveys, and new editions of the UN estimates can revise earlier figures.