The Emissions Race Screensaver
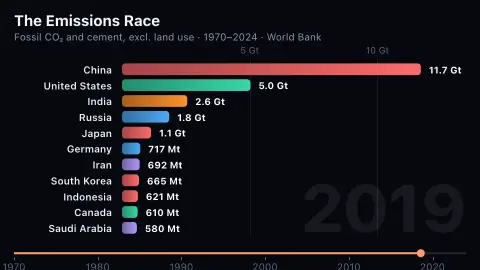
The Emissions Race is a bar chart race screensaver that ranks countries by CO2 emissions from fossil fuels and cement, year by year from 1970 to the latest World Bank year. On this series China overtakes the United States in 2005. It is free, key-less and runs in your browser.
Live preview
Press ESC to leave fullscreen. Settings are saved in your browser only.
How the The Emissions Race screensaver works
The pipeline reads the World Bank's carbon-dioxide series (excluding land-use change, in million tonnes) for every country and packs it into one small file.
The chart starts in 1970, when the underlying inventory does, rather than at a decade boundary, so it never opens on empty frames.
Bars are ranked, interpolated between years and coloured by region. Each pass in the leading group is announced when it occurs.
The numbers are territorial: emissions produced inside a country's borders. They do not charge a country for the goods it imports, which flatters importers and is the convention most national inventories use.
Territorial carbon accounting and the countries that lead it
Carbon dioxide from burning fossil fuels and making cement is the largest part of human-caused greenhouse gas emissions. The World Bank series used here, carbon dioxide emissions excluding land use, land-use change and forestry, starts in 1970 and draws on the EDGAR database of the European Commission's Joint Research Centre, which counts fossil-fuel combustion and industrial processes such as cement production.
The ranking responds as much to population and industrialisation as to policy. Large, fast-growing economies climb as they build power plants, steel mills and cement works, and countries that decarbonise or deindustrialise fall back even while remaining wealthy. Per-person emissions tell a different story, since dividing by population lifts small, energy-intensive countries and lowers populous ones.
Territorial figures also leave out emissions from land-use change such as deforestation, and they count where emissions occur rather than where goods are consumed. Cumulative emissions, the total added to the atmosphere over decades, matter for the climate more than a single year's rank, and countries that industrialised early hold a much larger historical share than a race ranking by annual output would suggest.
A worked example
In 1970 the United States emits about 4.6 billion tonnes of CO₂ with Russia (1.3 billion) and Germany (1.1 billion) behind. By 2024 China emits 13.1 billion tonnes, the United States 4.6 billion — almost exactly where it started — and India 3.2 billion.
Settings & tips
- Countries shown sets the number of bars.
- Start year skips ahead; Speed changes how quickly the years pass.
- Press ESC to leave fullscreen.
Frequently asked questions
- What exactly is counted?
- CO₂ from burning fossil fuels and making cement, excluding land use and forestry, in million tonnes. Other greenhouse gases such as methane are not included.
- Why are these territorial rather than consumption-based?
- Because that is how the World Bank series is built and how most national inventories report. A consumption view would shift some of China's total onto the countries that buy its exports.
- Why does it start in 1970?
- That is where the underlying inventory begins. Earlier years have too few countries to rank.
- How often does it update?
- Whenever the data pipeline refreshes the World Bank series, which the Bank itself updates annually, so the last year shown trails the present by a year or two.
- Do these figures include methane and other gases?
- No. This series covers carbon dioxide only, from fossil fuels and cement. Methane, nitrous oxide and other greenhouse gases are tracked in separate datasets.
- Why do rankings look different per person?
- Dividing by population sharply raises the rank of small, energy-intensive countries and lowers that of large populous ones. The race shows totals, so population size matters a great deal.