Bitcoin Power Law Clock Screensaver
The Bitcoin Power Law Clock screensaver dials in where Bitcoin's real live price currently sits within the power-law growth corridor model — a popular, unofficial framework, clearly labeled as such. It's free, runs in your browser, and ESC exits.
Live preview
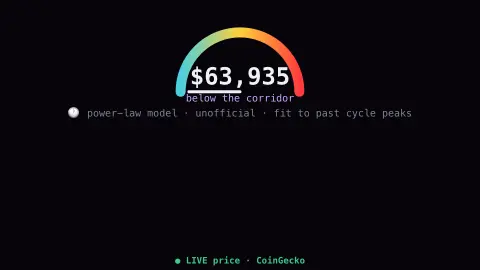
Press ESC to leave fullscreen. Settings are saved in your browser only.
How the Bitcoin Power Law Clock screensaver works
The power-law corridor is computed from a real, publicly shared formula based on days since Bitcoin's genesis block.
The saver fetches Bitcoin's real live price from CoinGecko, with no key required.
A needle sweeps to show where today's real price sits between the corridor's lower and upper bounds.
The dial updates live as the real market moves.
A power law for Bitcoin's long-term price
A power law is a relationship in which one quantity changes as a fixed power of another, so on a chart with both axes logarithmic it appears as a straight line. The Bitcoin power law model, associated with Giovanni Santostasi, plots Bitcoin's price against the number of days since the genesis block, which was mined on 3 January 2009. On log-log axes the price history looks close to a rising straight line, and a corridor is drawn around that line: a lower band and an upper band.
The dial places the current price in that corridor. Near the lower edge indicates the price is low relative to the historical fit, and near the upper edge, high. The method is descriptive, since it fits a trend to history. One published form is price = A × (days since genesis)^n with n around 5.8, while another indicator uses about 5.9, so the lines on one chart may not match those on another.
The big caveat is that a fit to the past does not guarantee the future. Bitcoin has a short history, so the model has little data to test against, and nothing forces the price to stay inside the corridor. The clock is an illustration of one framework for viewing the market. It is not a forecast, and is not investment advice.
A worked example
A needle sitting near the corridor's upper edge suggests the real price is running hot by this model's own framing — one popular lens, not a prediction.
Settings & tips
- Accent recolours the needle.
- This is a widely discussed but unofficial and contested model.
- The corridor itself is fixed math; only the live price needle moves.
Frequently asked questions
- What is the power-law model?
- A real, publicly shared framework proposing Bitcoin's price grows roughly as a power of time since genesis — popular among some on-chain analysts, contested by others.
- Is a key needed?
- No. The live price comes from CoinGecko's free, key-less public API.
- Is this guaranteed to be accurate?
- No model is — it's presented as one popular framework, not investment advice.
- Is it free?
- Yes — free, no download, in your browser.
- What is a log-log chart?
- A chart where both axes use a logarithmic scale. A power-law relationship, which curves on ordinary axes, turns into a straight line there, making the pattern easy to spot.
- Why measure time from the genesis block?
- It gives a common starting point for the age of the network, the genesis block having been mined on 3 January 2009, and the model uses elapsed days as its input.
- How is a power law different from exponential growth?
- An exponential grows by a constant percentage per unit of time. In a power law the percentage growth rate falls as time passes, so growth is gentler over the long run.