Population Pyramid Screensaver
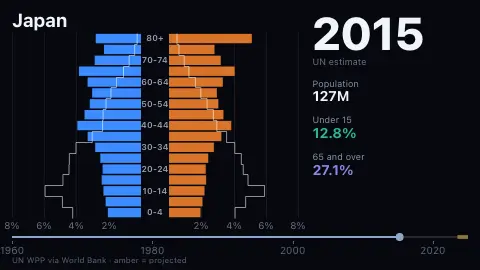
The Age Pyramid is a free population-pyramid screensaver. It shows one country at a time, with men on the left and women on the right in each five-year age band, and plays the shape forward from 1960 to 2025 before moving to the next country. It needs no key or account, and ESC exits.
Live preview
Press ESC to leave fullscreen. Settings are saved in your browser only.
How the The Age Pyramid screensaver works
The data are the World Bank's population-by-age indicators, SP.POP.0004.FE through SP.POP.80UP.MA: seventeen age bands (0-4 up to 80 and over) for each sex. The site's pipeline fetches all thirty-four series for 22 countries chosen for contrasting shapes, checks that every year is complete and that each year's shares add up to 100%, drops any country with a gap rather than patching it, and stores each band as a share of the population in thousandths of a percent.
Each bar is the share of the country's people in that age band. The horizontal scale is fixed for each country across all 66 years, so a base that is narrowing is really narrowing and not being re-zoomed. The faint outline is the same country in 1960, which makes the change visible at a glance. Between two consecutive years the bars are blended linearly; no year is invented.
Everything beside the pyramid is arithmetic on the bands. Under 15 and 65 and over are the sums of the first three and the last four bands. The dependency ratio is people under 15 plus people 65 and over, per 100 people aged 15 to 64. Median age is found by walking up the bands to the half-way person and assuming people are spread evenly inside each five-year band, so it is an approximation and can differ by a year or so from the UN's own figure.
Years from 2024 are marked 'UN projection': the bars turn dashed and semi-transparent, a tag appears by the year, and the timeline has an amber segment. The reason is that the World Bank figures come from the UN's World Population Prospects 2024, whose estimates end in 2023 and whose later years are medium-variant projections.
About the data and how to read a pyramid
A population pyramid stacks the age bands of a population, youngest at the bottom. A broad base means many children, which tends to follow high birth rates; a narrow base with a bulge higher up means births fell and a generation is ageing through. Wars, famines and migration leave notches and lopsided bars.
The numbers are the World Bank's indicators for population by age and sex, published through its open API. The World Bank describes them as its staff estimates using its total population and the age and sex distributions of the United Nations Population Division's World Population Prospects. The UN's 2024 revision, released in July 2024, estimates the past to 2023 and projects medium-variant futures after that; this saver marks 2024 and 2025 accordingly.
What the saver does not show: births, deaths and migration behind the changes, differences inside a country, or any forecast beyond 2025. Projections are not predictions of what will happen; they are what the UN's model produces under its medium assumptions.
A worked example
Japan in 1960: 93.2 million people, 29.8% of them under 15 and 5.7% aged 65 or over; the dependency ratio was 55 and the approximate median age was 26. In 2023 the population was 124.5 million, about 11.6% were under 15 and 29.6% were 65 or over; the dependency ratio was 70 and the approximate median age 50. Niger in 2023 had 47.0% of its 26.2 million people under 15 and 2.6% aged 65 or over. These match the World Bank's own under-15 and 65-plus totals for those years.
Settings & tips
- Country picks one country to loop, or Tour to move through all 22 in turn.
- Speed sets how fast the years pass.
- Male colour and Female colour recolour the bars; the defaults were chosen to stay distinguishable for the common kinds of colour blindness.
- Press ESC to leave fullscreen.
Frequently asked questions
- Are these census counts?
- No. They are World Bank staff estimates that combine the World Bank's total population with the age and sex distributions of the UN Population Division's World Population Prospects. Those are model estimates reconciled with censuses, surveys and registers, not a head-count in the year shown.
- Which years are projections?
- In the UN's 2024 revision, estimates run to 2023 and later years are medium-variant projections. The saver therefore marks 2024 and 2025 as projections. If the World Bank has moved to a newer UN revision since, the boundary could shift by a year, and the marking in the file is a fixed assumption, not something the World Bank API labels.
- Why is the scale fixed for each country?
- Because re-zooming every year would hide the main fact, which is how the shape changes. With a fixed scale a shrinking base shrinks. The scale differs between countries, so compare shapes, not bar lengths, across countries.
- Why does Qatar look lopsided?
- In the estimates there are far more men than women between roughly 25 and 55, which pushes the male side far out. The data do not say why; the shape is simply what the UN estimates for the resident population contain.
- What is the dependency ratio?
- People under 15 plus people 65 and over, per 100 people aged 15 to 64. It is a rough measure of how many people are, by age, likely to be supported by those of working age. It says nothing about who is actually working.
- Why only 22 countries?
- They were picked for contrast: old and shrinking, young and growing, and a few unusual shapes. A country is dropped from the file if any year or band is missing. There is no USSR or Yugoslavia, only today's country list.
- How is median age calculated?
- By finding the age at which half the population is younger, assuming people are spread evenly inside each five-year band. The UN computes it from single years of age, so its figure can differ slightly.