Child Mortality Board Screensaver
The Child Mortality Board screensaver ranks real under-5 child mortality rates per 1,000 live births by country. It is free, runs in your browser, and ESC exits.
Live preview
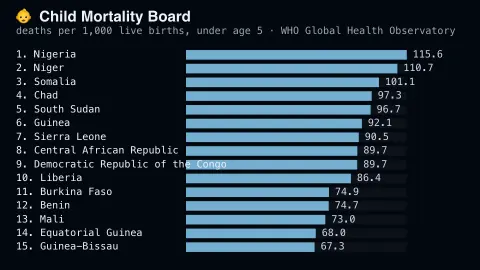
Press ESC to leave fullscreen. Settings are saved in your browser only.
How the Child Mortality Board screensaver works
The saver reads real under-5 child mortality rates per 1,000 live births data from the WHO's own Global Health Observatory API.
Countries are ranked by their real latest reported under-5 mortality rate.
The pipeline refreshes on the WHO's own periodic release schedule.
No key is required for this key-less public endpoint.
What the under-five mortality rate measures
Under-five mortality is the probability that a child born in a given year will die before reaching age five, expressed per 1,000 live births. Strictly it is a probability derived from age-specific mortality rates rather than a simple ratio of deaths to population. It is widely used as an overall indicator of child health and living conditions, because it responds to nutrition, infection, access to care, clean water, vaccination and maternity services, and it is the indicator behind Sustainable Development Goal 3.2.1.
The values in the WHO Global Health Observatory come from estimates produced by the UN Inter-agency Group for Child Mortality Estimation, which brings together UNICEF, WHO, the World Bank and the UN Population Division. Civil registration systems that record births and deaths continuously are the preferred source; where they are incomplete, the estimates draw on household surveys and similar data using a statistical model, and the figures come with uncertainty ranges that the saver does not show. Because common methods are used for every country, the figures can differ from national statistics.
A rate of 100 per 1,000 means about one in ten children dying before age five. The ranking compares countries at one point in time, and it hides large differences inside each country, between regions, income groups and rural and urban areas.
A worked example
A real country's most recent reported under-5 mortality rate is ranked against the real others, with bars easing into place as the board loads.
Settings & tips
- The rate is deaths before age 5 per 1,000 live births.
- Accent recolours the bars and header text.
- Values and years are real, unedited WHO Global Health Observatory data.
Frequently asked questions
- Is this real health data?
- Yes — real under-5 child mortality rates per 1,000 live births figures from the WHO's own Global Health Observatory API.
- Is a key needed?
- No. The GHO OData API is fully key-less.
- How often does it update?
- The pipeline re-reads the WHO's own dataset periodically, on whatever schedule WHO republishes that indicator.
- Is it free?
- Yes — free, no download, in your browser.
- Is this the same as infant mortality?
- No. Infant mortality covers deaths before the first birthday, while under-five mortality covers the first five years, so the under-five figure is always at least as high.
- Why are there uncertainty ranges?
- Many deaths are not formally registered, so agencies model the numbers from surveys and other data, and the true value is expressed as a plausible range.