Benford's Law Screensaver
Benford's Law, Tested is a free screensaver that counts the leading digits of real World Bank datasets, such as country populations, GDP and CO2 emissions, and animates the bars next to the Benford expectation, log10(1 + 1/d). It reports how far each set is from the law, including sets that do not follow it, and ESC exits.
Live preview
Press ESC to leave fullscreen. Settings are saved in your browser only.
How the Benford's Law, Tested screensaver works
Benford's law says that in many real collections of numbers the leading digit is not uniform: a 1 leads about 30.1% of the time and a 9 about 4.6%, because the expected share of digit d is log10(1 + 1/d). It tends to appear when numbers spread across several orders of magnitude and grow by something like multiplication. Where numbers sit in a narrow band, or are assigned or capped, it simply does not apply.
Every number here comes from the World Bank files already on this site (content/wbtime.json and content/wbcountry.json): country populations, GDP, CO2 emissions and GDP per person, plus two sets that cannot follow the law, life expectancy and the urban share of population. Some sets are one value per country in the latest year; others pool every country-year. Nothing is generated or simulated. The values are counted in a fixed shuffled order so you can watch the bars settle as the count grows.
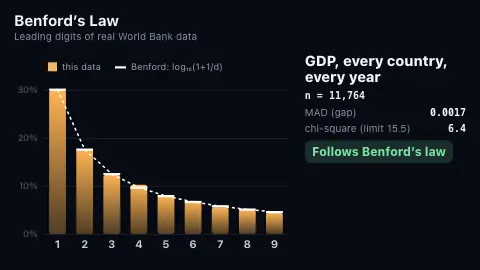
Two yardsticks are printed. Chi-square compares the counts with the expected counts (8 degrees of freedom; 15.5 is the 5% critical value). It is strict at large n, where a tiny gap becomes significant, and weak at small n. The mean absolute deviation (MAD) is the average gap between each digit's observed and expected share and does not depend on n; Nigrini's conventional bands are below 0.006 close, 0.006 to 0.012 acceptable, 0.012 to 0.015 marginal, and above 0.015 non-conforming.
The verdict is computed from those numbers, not asserted. A set is said to follow the law if its MAD is 0.006 or less or its chi-square is under 15.5, to roughly follow it if the MAD is under 0.015, and not to follow it otherwise. When the same country is counted in many years the observations are not independent, so the chi-square p-value overstates the evidence, and the screen says so.
Newcomb, Benford and Nigrini
The astronomer Simon Newcomb noticed in 1881 that the early pages of logarithm tables, those beginning with 1, were more worn than later ones. Physicist Frank Benford restated the pattern in 1938 in "The Law of Anomalous Numbers", testing it on data from 20 domains totalling 20,229 observations; the law now carries his name (Wikipedia, "Benford's law").
The mean absolute deviation test used here follows Mark Nigrini's conventional bands for first-digit data: 0 to 0.006 close conformity, 0.006 to 0.012 acceptable, 0.012 to 0.015 marginal, above 0.015 non-conformity. They are empirical conventions rather than a significance test, which is why the chi-square is shown beside them.
The data is World Bank Open Data. The World Bank publishes each series with a year, and countries report on different schedules, so a latest-year set mixes slightly different reporting years only at the edges.
A worked example
The GDP of every country in every year the World Bank reports, 11,764 values in the data used when this was written, gives a 1 as the leading digit 30.0% of the time against Benford's 30.1%, a 2 17.7% against 17.6%, and a 9 4.4% against 4.6%: a MAD of 0.0017 and a chi-square of 6.4. Life expectancy in 2024 across 217 countries runs from 54.6 to 86.5 years, so no value starts with 1, 2, 3 or 4, and 46.1% start with a 7: a MAD of 0.177.
Settings & tips
- Dataset picks one set to hold on, or rotates through all of them.
- Speed sets how long each count takes and how long the verdict stays up.
- Accent colour and Background restyle the chart.
- Press ESC to leave fullscreen.
Frequently asked questions
- Is Benford's law a law of nature?
- No. It is an empirical regularity that holds well for some kinds of data and not at all for others. It needs values that spread across several orders of magnitude; a set confined to a narrow band, like life expectancy, cannot follow it.
- Why do some datasets fail?
- Life expectancy only ranges from the 50s to the 80s, so the leading digits are 5, 6, 7 and 8. The urban share is a percentage that cannot exceed 100. Neither spreads across powers of ten, so the law has nothing to work with. The saver shows these on purpose.
- Why can a huge dataset be called only roughly Benford?
- With thousands of values, chi-square flags even tiny gaps as statistically significant. That is why the MAD, which does not grow with n, is shown too, and why a set can be marked as roughly following the law when its chi-square is large but its MAD is small.
- Does failing Benford mean the data is fabricated?
- No. This saver only describes whether a set's digits match the pattern. Forensic work uses it as a screening step on data that should follow the law, and a mismatch is a reason to look, not proof of anything.
- Why are some sets every country and every year pooled together?
- To have thousands of values rather than a couple of hundred. The catch is that the same country appears many times, so the values are not independent, and the chi-square p-value is too generous. The panel notes this.
- Where do the numbers come from?
- World Bank Open Data indicators (population SP.POP.TOTL, GDP NY.GDP.MKTP.CD, GDP per capita NY.GDP.PCAP.CD, CO2 EN.GHG.CO2.MT.CE.AR5, life expectancy SP.DYN.LE00.IN, urban share SP.URB.TOTL.IN.ZS), refreshed by this site's pipeline. Values are stored to about four significant figures, which is enough for leading digits.