The Yield Surface Screensaver
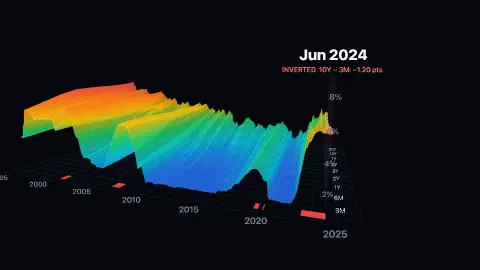
The Yield Surface is a 3D screensaver that draws the US Treasury yield curve as terrain — maturity across, time into the distance from October 1993, yield as height — and marks every month the curve was inverted in red. It uses monthly mean yields at nine maturities via FRED. It is free and key-less, and ESC exits.
Live preview
Press ESC to leave fullscreen. Settings are saved in your browser only.
How the The Yield Surface screensaver works
The pipeline reads nine constant-maturity Treasury series from three months to twenty years, averages each month, and packs the 397 months into a small grid.
The saver builds that grid as a surface in three.js. A bright slice carries the current month's curve through time while the landscape builds behind it, and the camera rides alongside before pulling back at the end.
A red marker on the left edge lights for every month in which the 10-year yield was below the 3-month — the inversion measure the New York Fed uses.
The 30-year is left out on purpose: Treasury did not publish it between February 2002 and February 2006, and a surface with a four-year hole would either show the hole or invent the numbers.
What the Treasury yield curve is telling you
US Treasury securities are loans to the federal government, and the yield is the annual return an investor earns on them at current market prices. Treasuries are issued at many maturities, and plotting yield against maturity gives the yield curve. The values here are constant-maturity yields: the Treasury builds a par yield curve from indicative bid-side quotations for recently auctioned securities, collected by the New York Fed near 3:30 PM each trading day, and reads yields off it at fixed maturities such as 3-month and 10-year.
Normally the curve slopes upward because lenders want extra return for tying money up longer. An inverted curve, with short-term yields above long-term ones, is unusual and has often come before US recessions, because it can reflect expectations that interest rates will fall or growth will slow. It is a correlation with a variable lead, not a precise forecast.
Short yields are heavily influenced by the Federal Reserve’s policy rate, while long yields reflect expectations for growth, inflation and the supply of and demand for bonds. Yields move opposite to bond prices, so a rising yield means falling prices. The surface is built from monthly averages, so it smooths out day-to-day swings and cannot show intramonth spikes. Nothing here is a trading signal or investment advice.
A worked example
Between October 1993 and now the 10-year yield sat below the 3-month in 52 of 397 months, in five spells: 2000–01, 2006–07, 2019, 2022–24 and a short stretch in 2025. The 2022–24 inversion alone lasts 25 months.
Settings & tips
- Speed sets how quickly the months pass.
- Maturity labels travel with the slice; the red floor markers are inversions.
- Press ESC to leave fullscreen.
Frequently asked questions
- What is an inverted yield curve?
- A month when short-term rates are above long-term ones, so the curve slopes down instead of up. It has often come before US recessions, but the lead time has varied and it is not a rule.
- Why monthly averages?
- A surface of every trading day would be some eight thousand rows and no clearer. The current month is a partial average of the days published so far.
- Why is there no 30-year yield?
- Treasury stopped publishing it for four years from February 2002. Rather than draw a gap or fill it with guesses, the surface leaves it out.
- Does it need WebGL?
- Yes. If your browser cannot create a WebGL context the saver says so instead of showing a blank screen.
- Why would a longer loan yield less than a shorter one?
- When investors expect rates to fall, demand for long bonds can push their prices up and yields down, while short rates stay high because of current central bank policy.
- What does constant maturity mean?
- It means the yield is read off the Treasury’s par yield curve at a fixed term, for example ten years, so the series stays comparable over time even though individual securities age.
- Does an inverted curve guarantee a recession?
- No. It has often preceded US recessions, but the lead time varies and it is not a precise forecast.