Yield Curve Screensaver
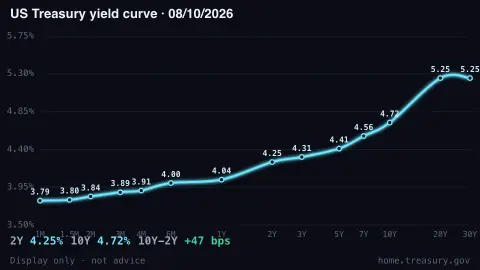
The Yield Curve screensaver is a live plot of the U.S. Treasury yield curve — interest rates from one month to thirty years — drawn fresh each day from the key-less Treasury data. It's free, runs in your browser, display only, and ESC exits.
Live preview
Press ESC to leave fullscreen. Settings are saved in your browser only.
How the Yield Curve screensaver works
The saver fetches the U.S. Treasury's daily yield-curve rates, the interest the government pays to borrow over different terms.
It plots yield against maturity from one month out to thirty years, drawing a smooth glowing curve with a value at each point.
The 2-year and 10-year yields are called out, along with the gap between them — a closely-watched recession signal.
When that 10-year-minus-2-year spread turns negative the curve is flagged as inverted, in red.
Reading the Treasury yield curve
When the U.S. Treasury borrows, it sells securities of different lengths: bills that mature in weeks or up to a year, notes that run for two to ten years, and bonds that run for twenty or thirty. Each maturity has its own yield, the annual return a buyer earns at the market price. Plot those yields against maturity and you have the yield curve, a snapshot of what the market is demanding to lend to the government over different horizons.
Normally longer loans pay more, because investors want compensation for tying up money and for the uncertainty of the future, so the curve slopes upward. When short-term yields rise above long-term ones, the curve is described as inverted. Inversions are watched as a possible warning of an economic slowdown, but the lead time has varied and an inversion is a debated signal rather than a forecast.
The Treasury builds its par yield curve from indicative bid-side quotations on the most recently auctioned bills, notes and bonds, collected by the Federal Reserve Bank of New York at or near 3:30 PM each trading day. Since December 2021 it has used a monotone convex method to interpolate between those points. Rates are usually available by about 6:00 PM Eastern, so the display reflects a daily close, not a tick-by-tick quote. This page is informational and is not a recommendation of any kind.
A worked example
On a normal day the curve slopes gently upward from a 3.8% one-month bill to a 4.4% thirty-year bond; when short rates rise above long ones the line dips and the board flashes INVERTED — the classic recession warning.
Settings & tips
- Curve color recolours the yield line.
- Background sets the panel backdrop.
- An inverted curve (10Y below 2Y) is highlighted in red.
Frequently asked questions
- Is the data live?
- Yes. It uses the U.S. Treasury's daily yield-curve figures, refreshed each business day, so the curve reflects the latest rates.
- What does an inverted curve mean?
- When short-term yields exceed long-term ones the curve inverts — historically a warning sign that a recession may follow.
- Is this investment advice?
- No. It's a display of public interest-rate data for ambiance, not advice of any kind.
- Does it need a key?
- No. The Treasury data is free and key-less; the saver only needs an internet connection.
- Is it free?
- Yes — free, no download, in your browser.
- What is the difference between a yield and a coupon?
- A coupon is the fixed payment a bond was issued with. A yield is the return implied by the bond's current market price, so it moves as the price moves.
- Why are the 2-year and 10-year yields watched so closely?
- They span the short and medium end of the curve, so the gap between them is a convenient shorthand for the curve's slope, and analysts track it as one indicator of market expectations.
- Does the curve update during the day?
- No. The Treasury's rates are based on quotations taken at or near 3:30 PM and are usually published by about 6:00 PM Eastern each trading day, so you see end-of-day values rather than live trading.