Euro Yield Curve Screensaver
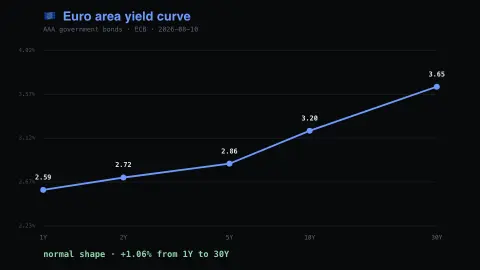
The Euro Yield Curve screensaver shows what the euro area pays to borrow at each maturity, from the ECB's key-less data warehouse. When the curve inverts — short rates above long — that is the market pricing cuts ahead. The site's Yield Curve saver covers US Treasuries. It's free, runs in your browser, and ESC exits.
Live preview
Press ESC to leave fullscreen. Settings are saved in your browser only.
How the Euro Yield Curve screensaver works
The saver reads the ECB Statistical Data Warehouse directly in your browser — no key and no account.
What the euro area pays to borrow at each maturity, from the ECB's key-less data warehouse.
It refreshes on a schedule, so what you see stays current.
Colours can be changed in settings; nothing is stored beyond your own browser.
The ECB yield curve, and why it is a fitted line
A yield curve plots the interest rate a borrower pays against the length of the loan. The European Central Bank estimates euro-area zero-coupon yield curves, and derives forward and par curves from them, because zero-coupon yields are not directly observable at most maturities. The estimates use prices of fixed-rate and zero-coupon euro bonds issued by euro area central governments, with the Svensson extension of the Nelson-Siegel model fitted to them, giving a continuous curve for residual maturities from three months to 30 years.
There is a wrinkle that is peculiar to the euro area. Each member country issues its own debt, so there is no single euro government bond. The ECB therefore calculates two sets of curves: one from AAA-rated central government bonds only, and one from all euro area central government bonds, including the AAA-rated ones. The AAA curve is described as a floor for euro area borrowing costs, and the two differ because investors charge different premiums for different countries' risk.
Normally longer loans pay more, because lenders want compensation for tying up money and for uncertainty, and the curve slopes upward. The shape reflects expectations about future central-bank rates plus a term premium that cannot be observed directly, so it should be read as the market's pricing and not as a forecast anyone has promised.
A worked example
What the euro area pays to borrow at each maturity, from the ECB's key-less data warehouse. When the curve inverts — short rates above long — that is the market pricing cuts ahead. The site's Yield Curve saver covers US Treasuries.
Settings & tips
- Accent and Background recolour the display.
- Data comes straight from the ECB Statistical Data Warehouse in your browser.
- Press ESC to leave fullscreen.
Frequently asked questions
- Is this real data?
- Yes — it comes from the ECB Statistical Data Warehouse and is refreshed on a schedule.
- What does an inverted curve mean?
- That short-dated bonds yield more than long-dated ones, which usually means the market expects rates to be cut. It is a signal about expectations, not a forecast.
- Is a key needed?
- No. This source is fully key-less.
- Is it free?
- Yes — free, no download, in your browser.
- Why does the euro area have more than one yield curve?
- Because each country issues its own bonds. The ECB calculates one curve from AAA-rated central government bonds and another from all euro area central government bonds, so the two differ.
- Is the curve a forecast of ECB interest rates?
- Not exactly. It combines expected future policy rates with a premium for holding longer bonds, and the two cannot be cleanly separated.
- What is a fitted curve?
- It is a smooth line estimated from many bond prices, using a formula, so that a rate can be read for any maturity even when no bond matures at precisely that date.