The Rate Landscape Screensaver
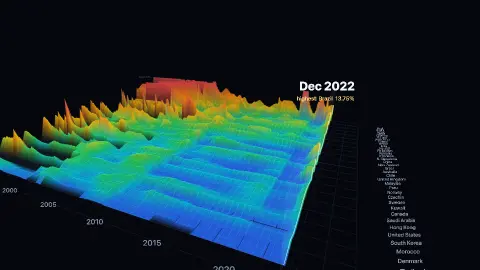
The Rate Landscape is a 3D screensaver that draws 38 central banks' policy rates since 1990 as terrain — time left to right, one row per bank, height as the rate — with a slice that sweeps through the months. It uses Bank for International Settlements data, is free and key-less, and ESC exits.
Live preview
Press ESC to leave fullscreen. Settings are saved in your browser only.
How the The Rate Landscape screensaver works
The pipeline reads the BIS's month-end policy rates, and the saver keeps the banks with at least twenty years of data that are still reporting — 38 of the 49.
Rows are sorted by each bank's average rate over the whole period, so the low-rate banks sit at the front and the ones that fought inflation hardest stand at the back.
Height is capped at 25%, because Brazil's rate was in the hundreds of thousands of percent in early 1990 and would otherwise be the only thing visible. Capped stretches are flat-topped.
A bank whose data started after 1990 shows a flat, dark plain before it begins, which means no data, not a zero rate. Banks whose series stopped early are left out rather than drawn as a cliff.
Why central banks set policy rates
A policy rate is the benchmark interest rate a central bank controls to steer the economy. Raising it makes borrowing more expensive, which tends to cool spending and inflation; lowering it encourages lending and growth. The instrument differs by country, so the Bank for International Settlements (BIS) defines the series as the target rate for the bank's main policy instrument, using the traded rate if there is no target and the midpoint where the bank sets a target band.
The BIS, based in Basel, publishes a central bank policy rates dataset covering more than 40 advanced and emerging economies. Monthly values are taken from the last business day of each month and are expressed in per cent per year. Most daily series begin after 1980, and some go back to 1946. When a bank changes its main instrument, the series shows the sequence of instruments and marks the breaks.
Comparing banks takes care. A rate of five per cent means something very different in a country with one per cent inflation than in one with ten, which is why economists look at the real rate, the nominal rate minus inflation. Policy rates also differ from what households pay on mortgages and savings, which depend on lenders' margins and market conditions.
A worked example
Looking along the front rows you can see the long slide in rates through the 2000s, the flat blue plain after 2009 when many policy rates sat at or near zero, and then a wall rising across almost every row at once from 2022.
Settings & tips
- Speed sets how fast the slice crosses the years.
- The label above the slice names the highest rate in the month it has reached.
- Press ESC to leave fullscreen.
Frequently asked questions
- Why are Argentina and Croatia missing?
- Their series stop before the present, and on a surface a missing value would look like a plunge to zero. Argentina is in the Rate Race chart instead, which can show a bank leaving the data honestly.
- Why cap the height at 25%?
- A few banks have had rates in the thousands of percent. Without a cap the whole landscape would be one spike.
- What is a policy rate?
- The interest rate a central bank sets for lending to commercial banks. It anchors other rates but is not the rate on a mortgage or savings account.
- Does it need WebGL?
- Yes, and it reports clearly if the browser cannot provide it.
- Why do countries in the same region have different rates?
- Each central bank responds to its own inflation, growth and currency conditions. Countries sharing a currency, such as the euro area, share one policy rate.
- What is a real interest rate?
- It is the nominal rate minus inflation. A positive real rate means borrowing is expensive after allowing for price rises, while a negative one means inflation is eroding the cost of debt.
- How does the BIS define a policy rate?
- It uses the target rate of the central bank's main policy instrument, the traded rate if no target exists, and the midpoint of a target band where one is set.