Bank of England Rate Screensaver
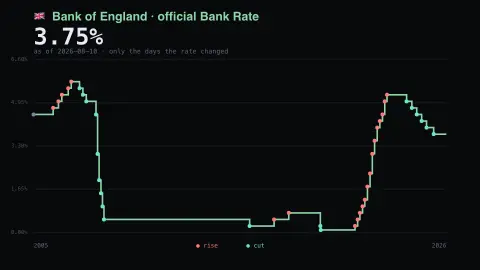
The Bank of England Rate screensaver shows the official Bank Rate drawn as a step chart showing only the days it actually changed, so every step is a real Monetary Policy Committee decision rather than a daily price. It's free, runs in your browser, and ESC exits.
Live preview
Press ESC to leave fullscreen. Settings are saved in your browser only.
How the Bank of England Rate screensaver works
The background pipeline reads this from the Bank of England statistical database and saves a snapshot the saver loads.
The official Bank Rate drawn as a step chart showing only the days it actually changed, so every step is a real Monetary Policy Committee decision rather than a daily price..
It refreshes on a schedule, so what you see stays current.
Colours can be changed in settings; nothing is stored beyond your own browser.
Bank Rate and the Monetary Policy Committee
Bank Rate is the core interest rate in the UK, set by the Bank of England. It is the rate paid to banks, building societies and other institutions that hold money with the Bank, and the rate charged on loans to them. Because it anchors what banks can earn or pay at the central bank, it feeds through to mortgage pricing, savings rates and the cost of borrowing more widely, though not one for one.
The rate is set by the Monetary Policy Committee, which meets eight times a year and has traditionally had nine members, who each vote. The Bank states a 2% inflation target, and the committee publishes minutes showing how each member voted. Between meetings the rate does not move, which is why a chart of it looks like a staircase rather than a wavy line.
The data come from the Bank's own statistical database, where the series records the official rate and the dates on which it changed. The saver therefore shows decisions, not market prices: a long flat stretch means the committee held the rate steady, and the height of each step is the size of the move. It says nothing about what any lender actually charges, and it does not forecast where the rate goes next.
A worked example
The official Bank Rate drawn as a step chart showing only the days it actually changed, so every step is a real Monetary Policy Committee decision rather than a daily price.
Settings & tips
- Accent and Background recolour the display.
- Run
automation/run.py boerateto refresh the feed. - Press ESC to leave fullscreen.
Frequently asked questions
- Is this real data?
- Yes — it comes from the Bank of England statistical database and is refreshed on a schedule.
- Why does the line look like stairs?
- Because a policy rate holds until it is changed. Drawing it as a step makes each Monetary Policy Committee decision visible instead of smoothing them into a curve.
- Is a key needed?
- No. This source is fully key-less.
- Is it free?
- Yes — free, no download, in your browser.
- Is Bank Rate the same as my mortgage rate?
- No. Bank Rate is the central bank's own rate; lenders add margins and price their products off market funding costs, so mortgage and savings rates follow it only loosely.
- How often does the committee meet?
- The Bank of England says its Monetary Policy Committee meets eight times a year, and the dates are published in advance.
- Why can the rate stay unchanged for a long time?
- The committee only moves it when its judgement of the inflation outlook calls for a change. A long flat stretch is a decision to hold, taken afresh at each meeting.