The Rate Race Screensaver
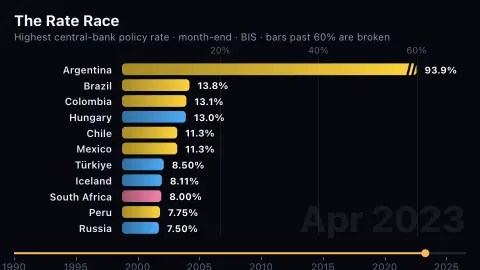
The Rate Race is a bar chart race screensaver ranking the policy interest rates of 49 central banks, month by month from 1990, using Bank for International Settlements data. Rates above 60% run off the chart with a break mark but still print their real value. It is free and key-less, and ESC exits.
Live preview
Press ESC to leave fullscreen. Settings are saved in your browser only.
How the The Rate Race screensaver works
The pipeline reads the BIS's central-bank policy-rate dataset, keeps one month-end value per bank, and packs it into a small file; the saver never calls the BIS directly.
Banks are ranked each month by their rate and drawn as bars coloured by region. Because many banks hold a rate unchanged for months, near-ties keep their on-screen order rather than flickering.
The scale stops at 60%. Brazil's rate was 97,138% a year in January 1990 and peaked at 355,086% in February; those bars run off the end of the chart with a break in them and label the true value.
Several euro members stop in 1998, when their policy rate became the European Central Bank's, and the Euro area appears in 1999. That is the data: the lines merged.
Reading central-bank rates over time
A central bank’s policy rate is the main instrument it uses to implement monetary policy. The Bank for International Settlements, an institution owned by central banks, publishes these rates in a common dataset of long time series in percent per year. For each economy the dataset uses the target rate or, if there is none, the traded rate for the main instrument; for a target band it shows the midpoint. Where no interest-rate instrument was used, it shows the most widely referenced money-market or central bank rate, so the label hides some differences between countries.
Rankings tend to be dominated by economies with high or unstable inflation. Central banks raise rates to defend a currency or contain price rises, and the leader of this race is often a country in or just after a crisis. Some rich economies, such as Japan and Switzerland, have spent stretches at zero or below.
A high rate is not by itself a sign of a strong or weak economy. Monthly values in the BIS data equal the last business day’s value of the month, so a rate that changed and changed back within a month will not appear. Euro-area members share the European Central Bank’s rate after the euro was introduced, which is why separate national lines end.
A worked example
By May 2008 the highest rate on the board is 15.5% — shared by Iceland, Serbia and Türkiye — with Brazil and Argentina not far behind. Seventeen years earlier the same chart has Brazil running off the end of the page at 489% in July 1991.
Settings & tips
- Banks shown sets how many bars race at once.
- Start skips the hyperinflation years if you would rather open in the mid-1990s or after the financial crisis.
- Press ESC to leave fullscreen.
Frequently asked questions
- Why are some bars cut off?
- Policy rates above 60% would flatten every other bar to nothing, so the scale is capped. A bar that exceeds it is drawn full length with a break mark and shows its actual value.
- Is the policy rate the same as my mortgage or savings rate?
- No. It is the rate a central bank sets for lending to commercial banks, which feeds into other rates but is not the same as them.
- Where did Germany, France and Italy go?
- Their individual rates end in 1998, when the euro's policy rate took over. The Euro area appears from 1999.
- Which banks are covered?
- The 49 central banks in the BIS dataset, which includes the large advanced economies and many emerging markets. Some, like Argentina, stop reporting before the present.
- Can a policy rate be negative?
- Yes. Some central banks, including the European Central Bank and the Bank of Japan, have at times set a policy rate below zero.
- Why would a country have a very high rate?
- Usually to fight fast inflation or to support a weak currency. High rates make holding the local currency more attractive but also raise borrowing costs across the economy.
- What rate does each bank’s series show?
- The BIS uses the target rate for the main policy instrument or, if there is none, the traded rate. For a target band it shows the midpoint, so the exact instrument differs between countries.