If the World Were 100 People Screensaver
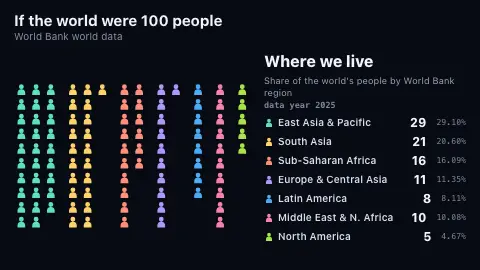
If the World Were 100 People is a free screensaver that shrinks the world to a grid of 100 person icons and regroups them, one statistic at a time, using World Bank world figures: age, region, income, internet, electricity, clean cooking, water, poverty and literacy. The data year is shown for each, and ESC exits.
Live preview
Press ESC to leave fullscreen. Settings are saved in your browser only.
How the If the World Were 100 People screensaver works
Each icon is one person in a hundred. The same hundred icons move from one grouping to the next, so you can watch people regroup from, say, the age bands to the regions, rather than seeing separate charts.
Every figure is a World Bank world aggregate, fetched by this site's pipeline from the key-less Indicators API (country code WLD, and the World Bank's own regional and income-group aggregates for the population splits). Each stat uses the latest year with a value, shown on its card; any indicator without a value in the last six years is dropped rather than shown stale.
Shares have to be whole people, so each is rounded with the largest-remainder method: take the whole part of every share, then give the leftover people to the groups with the biggest fractional parts. That makes every stat add to exactly 100, but a count can be up to one person away from the true share, so the unrounded percentage is printed beside it.
A few cards need care. Regional and income shares are each aggregate's population divided by world population in the same year. Male is 100 minus female, and the rural share is 100 minus urban. Water and sanitation are shown in three tiers, safely managed, basic only and below basic, which are differences between the World Bank's own nested indicators. Literacy is a share of adults aged 15 and over, not of all people.
Shrinking the world to a hundred
Scaling the world to 100 people is a way to make shares easier to feel than the raw numbers, which run to billions. Here the world is about 8.2 billion people, so one icon stands for about 82 million.
All figures come from World Bank Open Data. The World Bank compiles them from national statistical offices, UN agencies and household surveys, and some, such as access to clean cooking or safe water, are modelled estimates from partial surveys. Treat each as a rounded picture of the world as of its data year, not a census.
Shares of people are not shares of land, countries or money. A group of 5 icons, such as the 4.67% who live in North America, is a share of the world's people only.
A worked example
In the data fetched when this was written, 29.10% of the world's people live in East Asia & Pacific and 20.60% in South Asia, which rounds to 29 and 21 of the 100 (2025). The same year, 73.60% were online, so 74 are shown online and 26 offline. Safely managed drinking water reached 73.67% in 2024 and at least basic water 91.45%, so 74 have safely managed water, 18 basic only and 8 below basic. Extreme poverty, here the share below the $3.00-a-day (2021 PPP) line, was 10.10% in 2024, shown as 10 people.
Settings & tips
- Icon style switches between small people and plain dots.
- Speed sets how fast the icons regroup and how long each card stays up.
- Accent colour sets the colour of the first group in each card.
- Press ESC to leave fullscreen.
Frequently asked questions
- Are these real, current numbers?
- They are the latest World Bank world-aggregate values this site's pipeline could fetch, and each card shows its own data year. Survey-based indicators such as water, sanitation, poverty and clean cooking are modelled estimates and lag behind the population ones, typically by a year or two.
- Why do the numbers differ slightly from the percentages?
- Whole people cannot be fractions. Each stat is rounded to a whole number of people so the total is exactly 100, which can move a count by up to one person. The true unrounded percentage is shown beside each count.
- Why is literacy about adults?
- The World Bank indicator is the share of people aged 15 and over who can read and write. It is shown out of 100 adults, and the card says so, rather than treating children as non-literate.
- What is the poverty line?
- The card shows the exact line taken from the World Bank indicator's own name: currently $3.00 a day in 2021 purchasing-power-parity dollars. The World Bank revises this line from time to time, and the saver follows the indicator.
- Does this include every country?
- The world and regional aggregates cover every economy the World Bank counts. The regions are the World Bank's seven, in its current classification, and the income groups are its four.
- Where does the data come from?
- World Bank Open Data, world aggregates (api.worldbank.org, country WLD), refreshed monthly by this site's pipeline. Indicator codes are listed on each card.