UV Index Screensaver
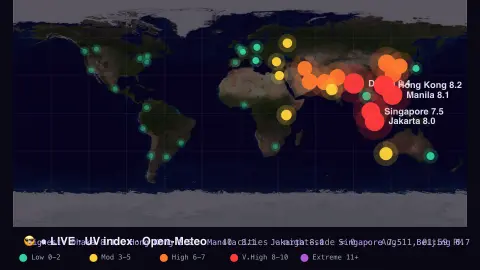
The UV Index screensaver is a live world map of the ultraviolet index, glowing from calm green to extreme violet over major cities by how strong the Sun's UV is right now, from the key-less Open-Meteo API. It's free, runs in your browser, and ESC exits.
Live preview
Press ESC to leave fullscreen. Settings are saved in your browser only.
How the UV Index screensaver works
The saver fetches the current UV index for a built-in list of major world cities (including Toronto, Vancouver, Montréal and Calgary) from the free Open-Meteo API.
Each city is drawn on a world map colored along the WHO UV scale — green is low, yellow and orange moderate to high, red very high, violet extreme.
The extreme spots pulse and are labelled, while cities in night read near zero.
It refreshes every few minutes as the Sun climbs and sinks around the world.
How the UV index is defined
The UV index was developed through an international effort by the World Health Organization with the United Nations Environment Programme, the World Meteorological Organization and the International Commission on Non-Ionizing Radiation Protection, and Germany's Federal Office for Radiation Protection took part. It condenses the strength of sunburn-producing ultraviolet radiation at ground level into one number. The sunburn-weighted irradiance is divided by 25 mW/m2, a value chosen because typical midday summer sunlight was about 250 mW/m2 when the index was designed, so the scale is open-ended and a reading of 12 is twice as intense as 6.
Several things set the value. Published descriptions list the solar zenith angle (the sun's height), total ozone, aerosols, elevation, reflectivity of snow and ice, and cloud transmission. The sun's height is why the index peaks near solar noon and falls to zero at night. WHO reports the daily maximum, which occurs around solar noon.
Categories run from low (0 to 2) through moderate (3 to 5), high (6 to 7) and very high (8 to 10) to extreme at 11 and above. The highest ground-level reading on record is generally cited as 43.3, at Licancabur volcano on the Bolivian-Chilean border on 29 December 2003, although other scientists dispute readings above 26. This page is a view of conditions, not personal guidance; local health agencies publish recommendations.
A worked example
At midday the tropics blaze violet at a UV of 12+ while the night side sits at a calm green 0 — a clean picture of where the Sun is fiercest right now, with the highest cities called out.
Settings & tips
- Refresh sets how often the readings update.
- Background sets the map backdrop.
- The legend maps each color to a WHO UV band.
Frequently asked questions
- Is the UV data live?
- Yes. Every city's UV index comes live from Open-Meteo and refreshes every few minutes as the Sun moves.
- What do the colors mean?
- They follow the WHO scale — green low, yellow/orange moderate to high, red very high, violet extreme — the same bands used in sun-safety advice.
- Why are some cities at zero?
- Cities in darkness get no sunlight, so their UV index reads about zero until the Sun rises.
- Does it need a key?
- No. Open-Meteo is free and key-less; the saver only needs an internet connection.
- Is it free?
- Yes — free, no download, in your browser.
- What is the highest UV index on Earth?
- A reading of 43.3 at Licancabur volcano, on the Bolivian-Chilean border, on 29 December 2003 is the figure usually cited, though other scientists dispute readings above 26. Any value of 11 or more is classed as extreme.
- Does cloud lower the UV index?
- Cloud transmission is one of the factors that set surface UV, so cloud cover affects the value, and cloud conditions can cause forecast errors.
- Why is the UV index not the same as temperature?
- The index depends on the sun's height, ozone, aerosols, elevation and ground reflectivity, not on air temperature, so a cool clear day can still have a high value.