The Phillips Loop Screensaver
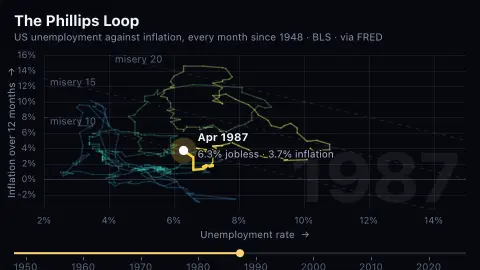
The Phillips Loop is a screensaver that plots every month of US history since 1948 as a point — unemployment across, inflation up — and joins them in order into one animated path. It uses BLS unemployment and CPI inflation via FRED, is free and key-less, and ESC exits.
Live preview
Press ESC to leave fullscreen. Settings are saved in your browser only.
How the The Phillips Loop screensaver works
Monthly unemployment and the twelve-month change in the CPI are read from FRED by the data pipeline and packed into one small file.
The path is drawn month by month, coloured by date; recent months are bright and older ones fade to a faint trace but never vanish, so the loops accumulate into a picture.
Faint diagonal lines mark the misery index — unemployment plus inflation — as a rule of thumb for how bad a given month was. It is a convention, not an economic law.
Short era captions appear as the path passes through each period. Every figure in them was checked against this same data, and inflation is the seasonally-adjusted CPI series FRED publishes, so peaks can differ from headline figures by a tenth or so.
The Phillips curve and its loops
In 1958 the New Zealand-born economist A. W. Phillips, of the London School of Economics, published “The Relation between Unemployment and the Rate of Change of Money Wage Rates in the United Kingdom, 1861–1957” in Economica. It found that when unemployment was high, wage growth tended to be stable or fall, and when unemployment was low, wages rose quickly. In 1960 Paul Samuelson and Robert Solow made the link between inflation and unemployment explicit for the United States, and the relationship became known as the Phillips curve.
The trade-off did not hold steady. In the 1970s many countries had high inflation and high unemployment at once, stagflation, which the simple curve had not predicted. Milton Friedman and Edmund Phelps had argued in 1967–68 that the curve holds only in the short run and shifts when expected inflation changes, which gave the expectations-augmented Phillips curve. Most economists now treat the relationship as shifting rather than as a fixed menu for policymakers.
Drawing each month as a point and joining them produces loops because the economy rarely moves along a single line. The data come from the Bureau of Labor Statistics via FRED, and both unemployment and inflation measures are subject to revision and definitional change over seven decades. The path shows association, not cause, and the unemployment-plus-inflation sum on the diagonals is a simple rule of thumb, not an official statistic.
A worked example
The path climbs through the 1970s to a 12.2% inflation peak in November 1974, then loops out to 14.6% inflation in 1980 and 10.8% unemployment in 1982 under Volcker's squeeze. In April 2020 it shoots straight up the unemployment axis, from 4.4% to 14.8%, in a single month.
Settings & tips
- Speed sets how quickly the months pass.
- Watch the head of the path: it is labelled with the month and both rates.
- Press ESC to leave fullscreen.
Frequently asked questions
- What is the Phillips curve?
- An observed trade-off between unemployment and inflation: when unemployment is low, inflation tends to be higher. The loops here show it holding in some decades and breaking in others — the 1970s, notably, had both high.
- What is the misery index?
- Unemployment plus inflation, a crude single number for economic discomfort. The faint diagonals show where it equals 10, 15 and 20.
- Where does the data come from?
- Unemployment from the Bureau of Labor Statistics and inflation from its CPI-U series, both republished by FRED.
- Is the inflation figure the one in the headlines?
- Close, but not identical: headlines use the non-seasonally-adjusted index, and this uses FRED's seasonally-adjusted one, so a peak can differ by about a tenth of a point.
- Who was A. W. Phillips?
- A New Zealand-born economist who spent most of his academic career at the London School of Economics. His 1958 paper in Economica studied UK data from 1861 to 1957 and gave the curve its name.
- Did the Phillips curve stop working?
- The simple version failed to predict the stagflation of the 1970s, when inflation and unemployment were both high. Economists revised it into an expectations-augmented form that shifts with expected inflation.
- Who extended the Phillips curve to the United States?
- Paul Samuelson and Robert Solow, in a 1960 paper in the American Economic Review, linked inflation and unemployment explicitly, extending Phillips’s relationship between wages and unemployment.