The US Economy Carousel Screensaver
The US Economy Carousel is a screensaver that rotates through twenty long US economic series — inflation, unemployment, interest rates, oil, gasoline, eggs, the Fed's balance sheet and more — drawing each as a chart with recession shading and showing how today's value compares with the series' whole history. It is free and key-less, and ESC exits.
Live preview
Press ESC to leave fullscreen. Settings are saved in your browser only.
How the US Economy Carousel screensaver works
The pipeline downloads each series from FRED, converts it to monthly (or its native quarterly or annual) values, computes year-on-year changes where that is the natural view, and packs all twenty into one small file.
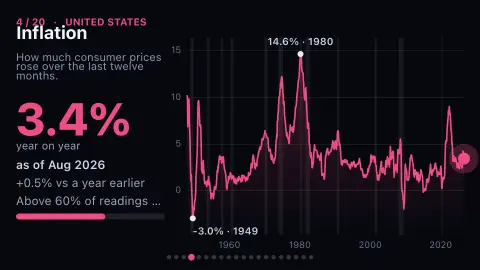
Each card draws its line from the first observation to the latest, shades US recessions behind it, and counts the headline figure up from the series' lowest value.
Beneath the number is its percentile: the share of readings in the series' own history that were lower than today's. It says how unusual a level is, not whether it is good.
Daily and weekly series are monthly averages, and the latest month is whatever has been published so far, so it can be partial.
FRED and the long view on the economy
FRED, short for Federal Reserve Economic Data, is an economic database provided by the Economic Research Division of the Federal Reserve Bank of St. Louis. It gathers a very large number of economic time series from many government agencies and other sources into one uniform format, and its companion ALFRED archives earlier vintages of the same data. Its value is breadth: inflation, an oil price and an interest rate can be pulled side by side.
Series differ in more ways than the title suggests. Some are indexes with an arbitrary base year, some are rates, some are dollar prices that have not been adjusted for inflation, and some are seasonally adjusted while others are raw. An old dollar figure is not directly comparable with a recent one unless it has been converted to real terms, so a high percentile for a price may partly reflect decades of general price growth.
Recession shading on charts like these follows the chronology kept by the National Bureau of Economic Research. Its Business Cycle Dating Committee has no fixed formula, weighs economy-wide measures such as real personal income less transfers and nonfarm payroll employment, and waits until a number of months after a peak before identifying it. Many series are also revised after first release, so the latest points are the least settled.
A worked example
At the time of writing the inflation card reads 3.4% for August 2026 — higher than 60% of readings since 1948 — against a peak of 14.6% in March 1980 and a low of −3.0% in 1949.
Settings & tips
- Order can shuffle the cards instead of running them in sequence.
- Speed sets how long each card stays on screen.
- Press ESC to leave fullscreen.
Frequently asked questions
- Where does the data come from?
- US federal statistics from the Bureau of Labor Statistics, the Bureau of Economic Analysis, the Federal Reserve, the Energy Information Administration, Treasury and the Census Bureau, republished by FRED — plus Freddie Mac's 30-year mortgage rate.
- What does the percentile mean?
- The share of months in that series' history in which the value was lower than it is now. It is context, not a forecast or a judgement.
- Are the recession bars official?
- They follow the National Bureau of Economic Research's recession dates, as published through FRED.
- How current is it?
- As current as the last run of the data pipeline; each card states the month its latest figure is from.
- Who decides when a US recession starts and ends?
- The NBER's Business Cycle Dating Committee maintains the chronology of US peaks and troughs. It has no fixed formula, emphasises economy-wide measures such as employment and income, and tends to wait a number of months after a turning point before announcing it.
- Why are prices not adjusted for inflation?
- Many series, such as gasoline or egg prices, are reported in nominal dollars. A record high in nominal terms is not the same as a record in real purchasing power.
- Do older data points get revised?
- Data can be revised after first release as agencies receive fuller information, which is why FRED's companion ALFRED archives earlier vintages. The most recent points are the ones most likely to change.