US Inflation Rate Screensaver
The US Inflation Rate screensaver shows the US Consumer Price Index from the Bureau of Labor Statistics' key-less API, shown as the year-on-year change each month — which is the number people mean when they talk about inflation. It's free, runs in your browser, and ESC exits.
Live preview
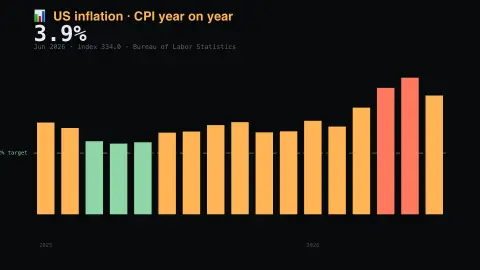
Press ESC to leave fullscreen. Settings are saved in your browser only.
How the US Inflation Rate screensaver works
The saver reads the Bureau of Labor Statistics directly in your browser — no key and no account.
The US Consumer Price Index from the Bureau of Labor Statistics' key-less API, shown as the year-on-year change each month — which is the number people mean when they talk about inflation..
It refreshes on a schedule, so what you see stays current.
Colours can be changed in settings; nothing is stored beyond your own browser.
The Consumer Price Index behind the headline
The Consumer Price Index, or CPI, is published monthly by the US Bureau of Labor Statistics. It measures the average change over time in prices consumers pay for a representative basket of goods and services. The headline CPI-U covers all urban consumers, which BLS says is over 90 percent of the US population. BLS data collectors record about 80,000 item prices a month in stores, service providers and rental units, in person or by web, app or phone.
The index itself is a level; most series use 1982-84=100 as the base. Inflation is the percentage change in that level, and the display shows the change compared with the same month a year earlier, which is the figure most news reports quote. Item weights come from the Consumer Expenditure Surveys of what households actually buy, with a lag of a couple of years.
There are several versions of the index. The all-items figure includes food and energy, whose prices are relatively volatile, while the “all items less food and energy” index is the one often called core. The index describes an average, so your own experience may differ if you rent, drive a lot or spend on categories that rose faster. Seasonally adjusted indexes can be revised for up to five years after first release, and the CPI is not a prediction of future prices.
A worked example
The US Consumer Price Index from the Bureau of Labor Statistics' key-less API, shown as the year-on-year change each month — which is the number people mean when they talk about inflation.
Settings & tips
- Accent and Background recolour the display.
- Data comes straight from the Bureau of Labor Statistics in your browser.
- Press ESC to leave fullscreen.
Frequently asked questions
- Is this real data?
- Yes — it comes from the Bureau of Labor Statistics and is refreshed on a schedule.
- Why show the change rather than the index?
- Because the index level alone is meaningless out of context. The year-on-year change is the figure people are referring to when they say inflation was three percent.
- Is a key needed?
- No. This source is fully key-less.
- Is it free?
- Yes — free, no download, in your browser.
- What is the difference between headline and core inflation?
- Headline uses all items, while core is the index for all items less food and energy, whose prices are relatively volatile, giving some users a view of underlying inflation.
- Why compare with the same month last year?
- A 12-month percent change is the usual way to express annual inflation, and comparing the same month in consecutive years avoids seasonal patterns.
- Does the CPI reflect my personal cost of living?
- Only roughly. It tracks the average change in prices for a representative basket, so households with different spending patterns can experience higher or lower inflation than the published figure.