Labor Force Participation Screensaver
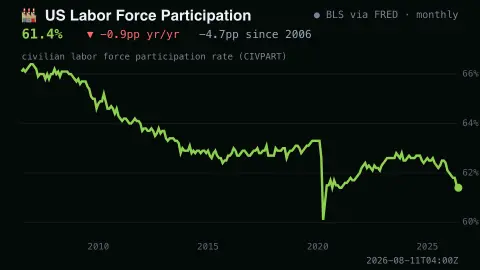
The Labor Force Participation screensaver draws the real monthly US participation rate (BLS series CIVPART, via FRED) as a clean 20-year line chart, headlined with the current rate and how it has moved. It's free, needs an internet connection, and ESC exits.
Live preview
Press ESC to leave fullscreen. Settings are saved in your browser only.
How the Labor Force Participation screensaver works
A pipeline script pulls the BLS civilian labor force participation rate (CIVPART) from FRED into content/laborforce.json — 240 monthly points, no key needed.
The saver draws it as a line chart with whole-percent gridlines and year ticks along the bottom.
The headline shows the latest rate to one decimal, the change versus a year ago, and the drift since the start of the window in percentage points.
It's a monthly official series published with the jobs report, so the chart moves on the BLS schedule — slow by design.
What the participation rate does and does not count
The labour force participation rate is the number of people in the labour force, employed plus unemployed, divided by the civilian non-institutional population aged 16 and over. It comes from the Current Population Survey, a monthly household survey whose interviews are conducted by the Census Bureau and whose results the Bureau of Labor Statistics publishes. The St. Louis Fed’s FRED service redistributes the rate as the series CIVPART. People who are retired, in school full time, caring for family or no longer searching are outside the labour force.
That makes the rate different from the unemployment rate. Someone who gives up looking leaves the labour force rather than counting as unemployed. Because the denominator is the whole adult population, the rate is sensitive to demographics: as a large generation ages into retirement, the headline rate can drift down even if each age group’s behaviour has not changed. Economists often look at the prime-age rate, covering ages 25 to 54, to reduce that effect.
The survey covers about 60,000 households a month, and its responses are weighted to match independent Census Bureau population estimates. As with any sample survey, individual monthly moves carry sampling error, so read the line as a slow-moving trend; one month’s change is rarely meaningful by itself.
A worked example
At the full 20-year window the line tells a whole demographic story: roughly 66% in the mid-2000s, the long post-recession slide, the sharp 2020 notch, and the partial recovery to the low 60s. In Multi-view it pairs well with US Job Openings (JOLTS) — labor supply beside labor demand.
Settings & tips
- Years shown — zoom from a five-year close-up out to the full twenty-year sweep.
Frequently asked questions
- Is this real data?
- Yes. It's the BLS civilian labor force participation rate exactly as published on FRED — the share of the civilian population 16+ that is working or looking for work.
- Does it need an API key?
- No. The pipeline reads FRED's public CSV endpoint, which is key-less, and the saver just reads the resulting JSON feed.
- Why has participation fallen over 20 years?
- Mostly demographics — the baby-boom generation aging into retirement — plus lasting scars from the 2008 and 2020 recessions. The chart makes that slow structural drift visible.
- Does it work offline?
- No. It reads a small JSON feed over the internet; offline it shows a short notice instead of stale numbers.
- Is it free?
- Yes — free, no download, no key, in your browser. ESC exits.
- What is the difference between participation and employment?
- Participation counts people who are employed plus those actively seeking work, relative to the adult population. Employment counts only those with jobs, so the two measures can move in different directions.
- Why is the prime-age rate watched separately?
- It covers people from 25 to 54, a group less affected by students entering and older workers retiring. That makes it a cleaner read on the labour market than the overall rate.