Nuclear Power Share by Country Screensaver
The Nuclear Power Share by Country screensaver ranks countries by the percentage of their electricity generated from nuclear power, live from the World Bank's open data API. It's free, needs an internet connection, and ESC exits.
Live preview
Press ESC to leave fullscreen. Settings are saved in your browser only.
How the Nuclear Power Share by Country screensaver works
The saver calls the World Bank's key-less open data API for nuclear electricity share (EG.ELC.NUCL.ZS) with mrnev=1, so each bar is that country's most recent published grid mix.
Region and income aggregates are filtered out using the World Bank's own country metadata; countries with zero nuclear generation drop out naturally.
Countries are ranked by nuclear percentage and each bar eases toward its real value.
It refreshes hourly; the underlying IEA-sourced energy statistics update on the World Bank's own schedule.
What the nuclear share of electricity tells you
The indicator, World Bank code EG.ELC.NUCL.ZS, is electricity production from nuclear sources as a percentage of total electricity production. Total production is measured in gigawatt-hours and covers both electricity plants and combined heat and power plants. The data come from the International Energy Agency’s energy statistics, which for non-OECD countries are based on national data adjusted to match questionnaires completed by OECD member governments.
Reading it requires care. Because it is a share rather than a quantity, a small country with a few reactors can score higher than a giant with many more. Share of electricity is also different from share of total energy: electricity is only a portion of what a country uses. A high nuclear share is a snapshot of one year, and a closure, refuelling outage or restart can move a country’s figure from one year to the next.
The board only lists countries that report some nuclear generation, and countries without reactors drop away rather than appearing at zero. The World Bank notes that the IEA sometimes revises its series for political changes or methodology updates, so breaks in the series are unavoidable. The display is statistical and takes no position on nuclear policy.
A worked example
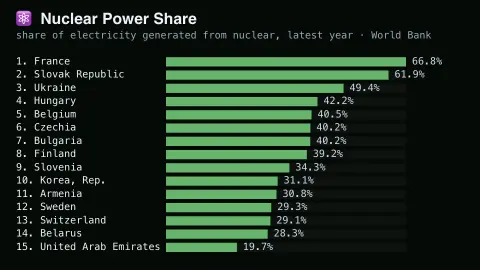
France famously leads with roughly two-thirds of its electricity from nuclear, with Slovakia close behind and Ukraine, Hungary and Belgium in the 40–50% band. Run it beside the Nuclear Reactor Status Board in Multi-view: one shows the fleets, this one shows how much of the grid they actually carry.
Settings & tips
- Countries shown — how many ranked rows to display (10–25).
- This board is about grid share, not size: France's ~65% outranks the United States, whose much larger fleet supplies under a fifth of a far bigger grid.
- Data years vary slightly by country — each value is the latest the World Bank has published.
Frequently asked questions
- Is this real data?
- Yes — the World Bank's official 'electricity production from nuclear sources (% of total)' indicator, fetched live from its open data API.
- How is this different from the Nuclear Reactor Status Board?
- That board tracks the reactor fleet itself — units and capacity per country, from IAEA data. This one ranks countries by the percentage of their electricity that is nuclear, so a small country with a few reactors can top it.
- Is a key needed?
- No. The World Bank open data API is public, key-less and CORS-enabled, so the browser calls it directly.
- Does it work offline?
- No. It fetches live from the World Bank, so it needs an internet connection; offline it shows a short notice.
- Is it free?
- Yes — free, no download, in your browser.
- Does a high share mean a country has many reactors?
- Not necessarily. The share depends on how much total electricity a country produces, so a few reactors in a small grid can produce a larger share than many reactors in a big one.
- Where does the data come from?
- The World Bank publishes the series in its World Development Indicators, sourced from the International Energy Agency’s energy statistics. The IEA sometimes revises its series, so breaks are unavoidable.