Unemployment by US State Screensaver
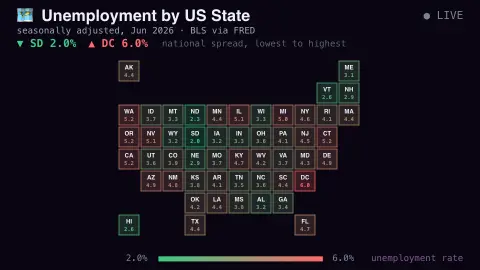
The Unemployment by US State screensaver draws the latest seasonally adjusted unemployment rate for all 50 states and DC as a classic tile-grid US map, colored from the lowest rate (green) to the highest (red). The data is real BLS data via FRED, gathered by the site's pipeline. It's free, needs an internet connection, and ESC exits.
Live preview
Press ESC to leave fullscreen. Settings are saved in your browser only.
How the Unemployment by US State screensaver works
The background pipeline pulls each state's latest seasonally adjusted unemployment rate from FRED's republication of BLS data into content/stateunemployment.json.
Every state plus DC gets a fixed square in the standard 11×8 tile-grid map layout — equal-size tiles arranged to echo US geography.
Tile color runs on a green-to-red scale between the current lowest and highest state rates; the legend along the bottom shows the scale.
The header shows the reference month and the national spread — the lowest and highest states right now.
Where state unemployment rates come from
State unemployment rates are produced by the Bureau of Labor Statistics under the Local Area Unemployment Statistics programme. They are not a direct count: each state’s estimate comes from a signal-plus-noise model that treats the Current Population Survey figure as the true value plus sampling noise, with inputs such as unemployment insurance claims and payroll employment. Estimates are also controlled each month to national CPS totals.
The unemployment rate counts people who are jobless, available for work and have actively looked in the past four weeks, as a share of the labour force. Someone who has given up searching, a discouraged worker, is not counted as unemployed, and a part-time worker who wants full-time hours counts as employed. That is why broader measures of labour underutilisation run higher.
State figures are seasonally adjusted and smoothed, so tiles can be compared between months. Statewide estimates appear roughly three weeks after the reference month, and historical values are revised once a year when new population controls and re-estimated models are introduced. Differences of a few tenths of a point between two states are small relative to the uncertainty in modelled estimates, so colour gaps between neighbours should not be over-read.
A worked example
In June 2026 South Dakota's 2.0% renders as a deep green tile while DC's 6.0% glows red, with California's 5.2% close behind — one glance shows the coasts running hotter than the plains. In Multi-view it pairs well with the European unemployment board.
Settings & tips
- Show rates on tiles — off, tiles show just the state codes for a cleaner, more abstract map.
- Rates are seasonally adjusted and periodically revised by BLS; the month in the header is the latest published.
- The color scale is relative to the current spread, so contrast stays strong even when all states are close.
Frequently asked questions
- Is this real unemployment data?
- Yes — the latest seasonally adjusted state unemployment rates published by BLS, fetched via FRED by the site's pipeline. Values are shown unedited.
- Do I need an API key?
- No. The feed is gathered key-less by the background pipeline; the saver just reads a local JSON file.
- Does it work offline?
- It needs a connection to read the feed; once loaded, the map keeps displaying the last data it fetched.
- Is it free?
- Yes — free, no download, in your browser.
- Why a tile map instead of a real map?
- Equal-size tiles give every state the same visual weight — small Northeastern states stay readable, and the color does the talking. It's a standard layout for state-level data.
- Why can a state rate be revised after publication?
- State estimates come from models that are re-estimated each year with new population controls, so earlier months are recalculated using fuller information.
- Does the unemployment rate include people who stopped looking?
- No. Only people who actively searched in the past four weeks and are available to work count as unemployed, so discouraged workers fall outside the headline rate.
- Is a low rate always a sign of a strong economy?
- Not necessarily. A rate can fall because people leave the labour force rather than find jobs, so economists look at participation and employment levels alongside it.