Short Interest Screensaver
The Short Interest screensaver shows real consolidated short interest reported to FINRA: how many shares of each stock are sold short, how that moved since the last report, and days-to-cover. Published twice monthly, so it is a periodic snapshot. It's free, runs in your browser, and ESC exits.
Live preview
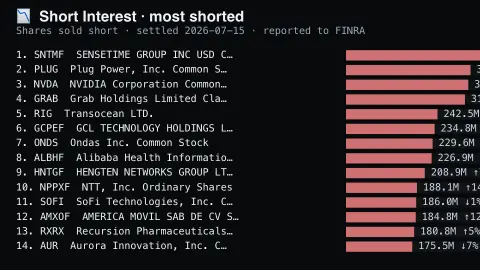
Press ESC to leave fullscreen. Settings are saved in your browser only.
How the Short Interest screensaver works
The background pipeline reads this from FINRA and saves a snapshot the saver loads.
Real consolidated short interest reported to FINRA: how many shares of each stock are sold short, how that moved since the last report, and days-to-cover.
It refreshes on a schedule, so what you see stays current.
Colours can be changed in settings; nothing is stored beyond your own browser.
How short interest is reported
A short seller borrows shares and sells them, hoping to buy them back later at a lower price and return them. Short interest is the total number of shares of a company that have been sold short and not yet covered. The Financial Industry Regulatory Authority, FINRA, requires member firms to report short positions in all equity securities twice a month, and it publishes the consolidated figures, so the data reflects positions at a settlement date and not today's.
Firms must file by 6 p.m. Eastern on the second business day after FINRA's designated settlement date, and FINRA then posts the results on a published calendar a little later, so there is always a lag. Days-to-cover divides short interest by a stock's average daily trading volume, giving a rough sense of how many days of normal trading it would take for short sellers to buy back their shares. A high figure points to a crowded position that could be hard to unwind quickly.
A large short position is not proof that a stock is going to fall. Shorts are also used to hedge other holdings or as part of arbitrage strategies, and heavily shorted stocks can rise sharply when shorts rush to cover. This board describes reported positions and is not advice about any stock.
A worked example
Real consolidated short interest reported to FINRA: how many shares of each stock are sold short, how that moved since the last report, and days-to-cover. Published twice monthly, so it is a periodic snapshot.
Settings & tips
- Accent and Background recolour the display.
- Run
automation/run.py shortinterestto refresh the feed. - Press ESC to leave fullscreen.
Frequently asked questions
- Is this real data?
- Yes — it comes from FINRA and is refreshed on a schedule.
- Is this live?
- No — FINRA publishes consolidated short interest twice a month, so this is the most recent periodic snapshot rather than a real-time figure.
- Is a key needed?
- No. This source is fully key-less.
- Is it free?
- Yes — free, no download, in your browser.
- What does days-to-cover mean?
- It is the number of shares sold short divided by average daily volume. It estimates how long it would take for shorts to buy back their positions at normal trading levels.
- Why is short interest published only twice a month?
- FINRA requires firms to report short positions twice a month, so the data is a periodic snapshot with a lag, not a live reading.
- Does high short interest mean the stock will fall?
- Not necessarily. It shows that many investors are betting on a decline, but positions can also be hedges, and a heavily shorted stock can rise sharply if shorts rush to buy back.