Live Seismograph Screensaver
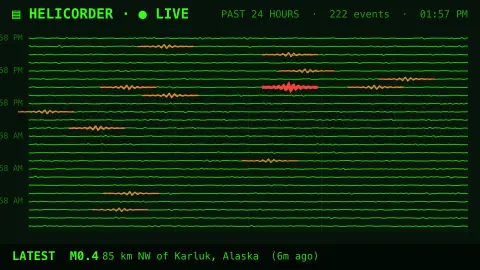
The Seismograph screensaver is a retro helicorder drum that traces the planet's live seismicity. Every recent earthquake from the USGS feed draws a real spike, scaled by its magnitude, on a scrolling green trace. It's free, runs in your browser, and ESC exits.
Live preview
Press ESC to leave fullscreen. Settings are saved in your browser only.
How the Seismograph screensaver works
The saver pulls the U.S. Geological Survey's live earthquake feed — every quake in the last hour or day, with its real time, place and magnitude.
It draws a stack of helicorder trace lines with a faint background micro-tremor, like a paper drum recorder.
Each real earthquake is placed at the exact x-position matching its event time and drawn as a damped spike whose height grows with magnitude; the biggest quakes are thicker and redder.
The drum scrolls slowly and the feed refreshes every minute, so new quakes appear as they're reported.
Magnitude scales and the USGS earthquake feeds
The U.S. Geological Survey publishes earthquake lists as feeds in GeoJSON, a JSON-based format. Each feed covers a time window (past hour, day, 7 days or 30 days) and a magnitude threshold, and is listed as updated every minute. Each event carries a magnitude, place, time, depth and the magnitude type used, plus a network code showing which seismic network contributed it.
The magnitude shown is a single number describing the size of an earthquake. The moment magnitude scale is the more accurate measure for all but small quakes; it is based on seismic moment, which depends on rock rigidity, fault area and slip. The older local (Richter) scale is now rarely used except for small earthquakes recorded locally. The scale is logarithmic: each whole-number step releases about 32 times more energy, even though recorded seismogram amplitude rises about tenfold per step.
Each event also has a depth, and each feed entry has a status field, so values on screen are a snapshot of the catalogue at that moment. A helicorder drum is the classic paper recorder attached to a single seismometer; here it is an artistic style, so the trace shows events from a catalogue and not raw ground motion at one place.
A worked example
During an active spell you'll watch the trace tick along quietly, then jump as a real M5.2 spike lands at its true time, with the latest event's magnitude and place called out below. Switch the window to the past hour for a tighter, busier drum.
Settings & tips
- Window chooses the past hour or the past day of seismicity.
- Trace color sets the phosphor color of the drum.
- Background sets the drum's backing color.
Frequently asked questions
- Are the spikes real earthquakes?
- Yes. Every spike is a real earthquake from the USGS feed, placed at its true time and scaled by its real magnitude. The faint baseline wiggle is decorative.
- Where does the data come from?
- The U.S. Geological Survey's public, key-less earthquake feed — the same source used by the Live Earthquakes saver.
- Does it show a specific seismometer?
- No — it's a stylised global drum that renders the whole feed as one helicorder. It conveys real activity, not one station's raw waveform.
- Does it need a key or account?
- No. The USGS feed is free and key-less; it only needs an internet connection.
- Is it free?
- Yes, and it runs entirely in your browser with no download.
- What magnitude types appear in the feed?
- Each event lists a magnitude type, such as moment magnitude or a local scale. Moment magnitude is the more accurate measure for most quakes, while the local scale is mainly used for small, nearby events.
- How much bigger is a magnitude 7 than a magnitude 5?
- Each whole step releases about 32 times more energy, so two steps is roughly a thousand times more energy (32 x 32 = 1,024), while measured seismogram amplitude rises about a hundredfold.