Sea Level Rise Tracker Screensaver
The Sea Level Rise Tracker screensaver shows the real, live monthly sea level record from a long-running NOAA tide gauge, with its own published long-term trend. It is free, runs in your browser, and ESC exits.
Live preview
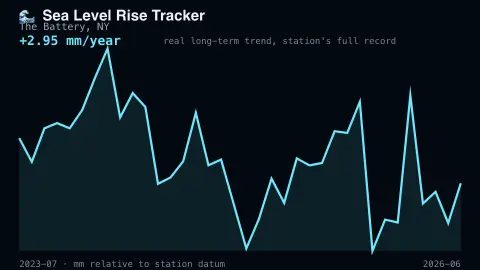
Press ESC to leave fullscreen. Settings are saved in your browser only.
How the Sea Level Rise Tracker screensaver works
The saver reads the real monthly mean sea level record from a NOAA Center for Operational Oceanographic Products and Services tide gauge station.
The real published long-term rise trend, in millimeters per year, is computed from the station's own data.
The pipeline refreshes the record on the source's own real monthly schedule.
No key is required for the published NOAA data.
Tide gauges and the long sea level trend
A tide gauge is a fixed instrument on a coast or pier that records the height of the water relative to a benchmark on land. In the United States the gauges used here belong to NOAA’s Center for Operational Oceanographic Products and Services (CO-OPS), and NOAA says periods of record range from a few decades to over a century. The gauge at The Battery in New York has a record that, per the Permanent Service for Mean Sea Level, begins in 1856.
The display shows monthly mean sea level, the average water height across a month, and a long-term trend in millimetres per year. Averaging removes the daily tidal cycle, but month to month figures still bounce with seasons, weather and ocean conditions. NOAA computes its rate of change over a long span of years, so a trend is far steadier than any single month.
This is relative sea level, meaning the sea surface measured against the land beside the gauge. If the land is sinking, the gauge shows a faster rise than the ocean alone would; if the land is rising, the opposite. NOAA’s trends product has a regional view showing how vertical land motion affects relative rates. One station therefore describes that coastline, not the global average.
A worked example
The real monthly mean sea level bounces with seasonal cycles, but the underlying real trend line steadily climbs over decades of measurement.
Settings & tips
- Accent recolours the trend line.
- Figures are real tide-gauge measurements, not modeled projections.
- The record updates monthly on NOAA's own real schedule.
Frequently asked questions
- Is this real tide gauge data?
- Yes — a real, long-running NOAA tide gauge station's own published record.
- Is a key needed?
- No. NOAA publishes this data freely.
- Does this reflect the whole ocean?
- It reflects one real long-running station; global sea level draws on many such stations plus satellite data.
- Is it free?
- Yes — free, no download, in your browser.
- What is the difference between relative and global sea level?
- Relative sea level is measured against local land, which can rise or sink. Global mean sea level is an average over the whole ocean, so it is not the same as any one gauge’s record.
- Why does the monthly line jump around?
- Seasonal cycles, weather and ocean conditions move water up and down on top of any long-term rise.
- What are the units on the chart?
- Heights are relative to a fixed station datum and the trend is in millimetres per year. The absolute level depends on the datum chosen, so changes are more meaningful than the level.