Groundwater Depletion Board Screensaver
The Groundwater Depletion Board screensaver ranks regions by real groundwater decline, from published NASA GRACE satellite research. It is free, runs in your browser, and ESC exits.
Live preview
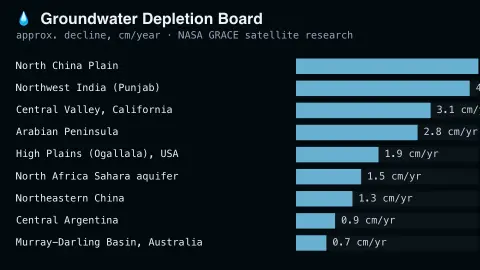
Press ESC to leave fullscreen. Settings are saved in your browser only.
How the Groundwater Depletion Board screensaver works
The saver displays a real, curated ranking of the world's most groundwater-stressed regions, from NASA's published GRACE satellite gravity-measurement research.
Each region shows its real reported rate of groundwater decline.
The board refreshes periodically as new real research is published.
No live feed is required — figures are a real, curated periodic snapshot.
Measuring groundwater from orbit
The ranking draws on research using NASA's GRACE mission, a pair of satellites launched on 17 March 2002 as a NASA and German Aerospace Center project. The two spacecraft measure how Earth's gravity field changes by tracking the distance between them with a microwave ranging system. Water has mass, so a large loss of water from a region changes the local pull of gravity by a measurable amount. A follow-on mission, GRACE-FO, continues the record.
Gravity data alone cannot say where the water went. Total water storage includes groundwater, soil moisture, surface water and snow, and researchers isolate groundwater by removing the other terms using observations or model output, so the result carries real uncertainty. GRACE tracks changes in water volume over regions a few hundred kilometres across and larger, so the figures describe whole aquifer regions rather than individual wells.
Rates of decline are usually expressed as an annual loss of water depth or volume, averaged over a study period. Because the figures come from published studies rather than a live feed, they are a snapshot of research findings, and different studies can rank the same regions differently depending on the years and methods used.
A worked example
A heavily irrigated real agricultural region shows a real measured decline rate of several centimeters a year, exactly matching the published satellite research.
Settings & tips
- Accent recolours the ranking bars.
- Figures are real satellite-derived measurements from NASA's GRACE mission.
- The board updates as new real research is published.
Frequently asked questions
- Is this real satellite data?
- Yes — real, published findings from NASA's GRACE satellite gravity-measurement missions.
- Is a key needed?
- No — figures are a curated real periodic snapshot.
- How does a satellite measure groundwater?
- GRACE detects tiny real changes in Earth's gravity caused by shifting underground water mass.
- Is it free?
- Yes — free, no download, in your browser.
- Can satellites see underground water directly?
- No. They measure changes in gravity linked to total water storage, and scientists remove other stores such as soil moisture and snow to estimate the groundwater change.
- Why do rankings differ between studies?
- Studies cover different years, use different methods to remove other water signals, and define regions differently, so rates and rankings can vary.
- Does a falling rate mean wells will run dry?
- Not by itself. The figures describe regional storage loss, while conditions at a particular well depend on aquifer depth, pumping and geology.