Permafrost Thaw Tracker Screensaver
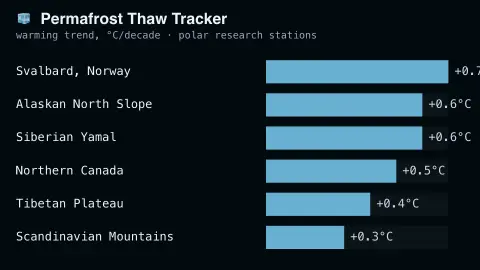
The Permafrost Thaw Tracker screensaver ranks Arctic regions by real published permafrost temperature warming trends. It is free, runs in your browser, and ESC exits.
Live preview
Press ESC to leave fullscreen. Settings are saved in your browser only.
How the Permafrost Thaw Tracker screensaver works
The saver displays a real, curated ranking of Arctic permafrost monitoring regions by their published warming trend.
Each region shows its real reported temperature change, in degrees per decade.
The board refreshes periodically as new real polar research is published.
No live feed is required — figures are a real, curated periodic snapshot.
How permafrost warming is measured
Permafrost is ground that stays at or below 0°C for two or more years, found across Siberia, Alaska, northern Canada and high mountains. Its temperature is monitored through boreholes, where sensors record the ground at set depths. The Global Terrestrial Network for Permafrost (GTN-P), established by the International Permafrost Association in 1999, collects these long-term records so trends can be compared across regions.
This board is a curated ranking rather than a live feed. Each Arctic region carries a reported change in ground temperature per decade, in degrees Celsius, drawn from published polar research. A larger figure means faster warming of the frozen ground. Ground temperature is not air temperature: the ground responds slowly and is shaped by factors such as snow cover.
Comparing regions needs care. Studies use different depths, periods and site selections. A 2019 Nature Communications analysis of GTN-P records found ground temperature near the depth of zero annual amplitude rose by 0.39 °C in continuous permafrost and 0.20 °C in discontinuous permafrost over 2007 to 2016, so colder ground often shows larger numbers. The figures describe trends in the ground, not how much carbon or infrastructure is at risk.
A worked example
A rapidly warming real Arctic monitoring region shows a real measured decadal warming trend, exactly matching published polar research station data.
Settings & tips
- Accent recolours the ranking bars.
- Figures are real measurements from polar research monitoring stations.
- The board updates as new real research is published.
Frequently asked questions
- Is this real research data?
- Yes — real, published permafrost monitoring station research.
- Is a key needed?
- No — figures are a curated real periodic snapshot.
- Why does permafrost matter?
- Thawing permafrost can release real stored greenhouse gases, a subject of active polar research.
- Is it free?
- Yes — free, no download, in your browser.
- Why is ground temperature measured in boreholes?
- Sensors at set depths record the thermal state of the ground over many years, which lets researchers compare long-term trends between sites.
- Is the ranking updated automatically?
- No. It is a curated list refreshed when new published research is added, so it reflects studies, not a live sensor network.
- Is permafrost warming everywhere at the same rate?
- No. A 2019 analysis of GTN-P records found different rates by zone, with continuous permafrost warming more over 2007 to 2016 than discontinuous permafrost, and mountain and Antarctic permafrost differing again.