Mangrove Forest Loss Board Screensaver
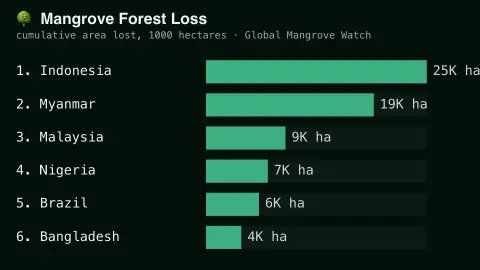
The Mangrove Forest Loss Board screensaver ranks countries by real published mangrove forest loss, from satellite research. It is free, runs in your browser, and ESC exits.
Live preview
Press ESC to leave fullscreen. Settings are saved in your browser only.
How the Mangrove Forest Loss Board screensaver works
The saver displays a real, curated ranking of countries by their published cumulative mangrove forest loss.
Each country shows its real reported area lost, from Global Mangrove Watch satellite monitoring.
The board refreshes periodically as new real research is published.
No live feed is required — figures are a real, curated periodic snapshot.
Measuring mangrove loss from space
Mangroves are salt-tolerant trees and shrubs that grow along tropical and subtropical coasts, in the zone where land meets sea. Global Mangrove Watch (GMW) maps their extent and change from satellite data. It was led by the Japan Aerospace Exploration Agency (JAXA), Aberystwyth University and solo Earth Observation, with Wetlands International and other partners, and its maps combine radar and optical imagery: its 2010 baseline used ALOS PALSAR radar and Landsat optical data, with change mapped over epochs between 1996 and 2016.
This board is a curated ranking, not a live feed. Each country shows a published figure for the area of mangrove lost, taken from satellite monitoring studies. Area is typically reported in hectares or square kilometres, and a country’s total depends partly on how much mangrove it had to begin with, so countries with extensive mangrove coasts can appear near the top.
Loss can come from human activity, such as clearing land for aquaculture or agriculture, and from natural processes such as erosion and storms, and some can be offset by regrowth elsewhere. A gross loss figure is therefore not the same as a net change, and the reporting periods in different studies may not match. Satellite maps also have resolution limits, so narrow or fragmented stands are harder to detect.
A worked example
A country with extensive real aquaculture-driven mangrove clearing tops the board, exactly matching published satellite monitoring figures.
Settings & tips
- Accent recolours the ranking bars.
- Figures are real satellite-derived measurements from Global Mangrove Watch.
- Mangroves are real vital coastal-protection and carbon-storage ecosystems.
Frequently asked questions
- Is this real satellite data?
- Yes — real, published findings from Global Mangrove Watch satellite monitoring.
- Is a key needed?
- No — figures are a curated real periodic snapshot.
- Why do mangroves matter?
- They provide real coastal storm protection and store significant carbon.
- Is it free?
- Yes — free, no download, in your browser.
- Does loss mean mangroves were all cut down?
- Not necessarily. Loss can come from clearing, but also from natural processes such as erosion and storms.
- Why do big countries top the board?
- Cumulative area lost depends partly on how much mangrove a country has, so countries with extensive mangrove coasts tend to show larger figures.
- Who produces the maps behind these figures?
- Global Mangrove Watch is a collaboration led by JAXA, Aberystwyth University and solo Earth Observation, working with Wetlands International and other partners, using satellite radar and optical data.