Marine Heatwave Map Screensaver
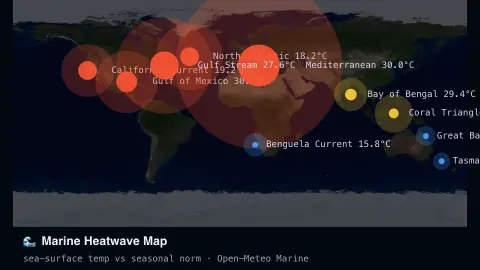
The Marine Heatwave Map screensaver reads live sea-surface temperature at a set of ocean points worldwide and colour-flags each against its seasonal norm, so unusually warm water stands out at a glance — key-less, live from the Open-Meteo Marine API. It's free, runs in your browser, and ESC exits.
Live preview
Press ESC to leave fullscreen. Settings are saved in your browser only.
How the Marine Heatwave Map screensaver works
The saver fetches live sea-surface temperature for a fixed set of ocean points from the key-less Open-Meteo Marine API.
Each point is compared against a typical seasonal baseline for that location and month.
Points warmer than normal glow orange to red; near-normal points stay a calm blue.
The map refreshes on a schedule so the picture tracks real conditions as they change.
What counts as a marine heatwave
A marine heatwave is commonly defined, following Hobday and colleagues (Progress in Oceanography, 2016), as an anomalously warm water event lasting five or more days with temperatures above the 90th percentile of a 30-year historical baseline. The paper also describes events by their duration, intensity, rate of evolution and spatial extent, which is why one hot reading is not enough: persistence and a local baseline both matter.
That is why the map compares each point with a typical value for the place and time of year instead of showing raw temperatures. A warm reading in a tropical sea is normal, while the same value in a cold current might be extraordinary. The difference from the typical value is called an anomaly.
The sea-surface temperature comes from Open-Meteo’s Marine API, which lists it as the temperature close to the water surface, drawn from a Météo-France dataset at about 8 km resolution. Each location is a point reading rather than a full satellite analysis, so the picture is coarser than an official map. The baseline here is an approximation, so the colours indicate unusual warmth and not a confirmed event under the formal criteria.
A worked example
During a Pacific marine heatwave you might see the points off California and Hawaii glow deep orange — several degrees above normal — while the North Atlantic stays a cool blue.
Settings & tips
- Show temperatures toggles the numeric readout at each point.
- Accent recolours the warm-anomaly glow.
- Baselines are approximate seasonal climatology, not a single official product.
Frequently asked questions
- Is this an official NOAA marine-heatwave product?
- No — it's a live approximation using real sea-surface temperature against seasonal norms, not the official NOAA Coral Reef Watch alert system.
- Is a key needed?
- No. Open-Meteo Marine is free and key-less.
- How often does it refresh?
- On a set interval, matching the pace ocean temperature actually changes.
- Is it free?
- Yes — free, no download, in your browser.
- What is sea-surface temperature?
- The temperature close to the water surface. It is a single layer of the ocean, and deeper water can be much cooler.
- What counts as a marine heatwave?
- A widely used definition is water warmer than the 90th percentile of a 30-year baseline for at least five days in a row.
- Is a warm point always a heatwave?
- No. A heatwave needs unusual warmth that lasts, so one reading above normal does not meet the formal definition by itself.