The Inflation Carpet Screensaver
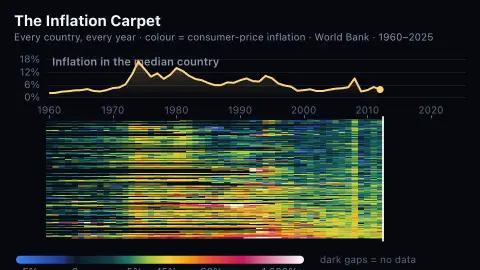
The Inflation Carpet is a heat-map screensaver: one row per country, one column per year from 1960, coloured by how fast consumer prices rose, swept left to right with a running median line above it. It uses World Bank data for 176 countries, is free and key-less, and ESC exits.
Live preview
Press ESC to leave fullscreen. Settings are saved in your browser only.
How the The Inflation Carpet screensaver works
The pipeline packs the World Bank's consumer-price inflation series for every country, and the saver keeps the 176 that have at least twenty years of figures.
Rows are sorted by each country's own median inflation, so the usually-calm countries settle at the top and the ones that fought inflation for decades sink to the bottom.
Colour runs on a symmetric-log scale — blue for falling prices, dark for none, then teal, yellow, orange, red and finally white — because one legend has to cover both −2% and four-figure hyperinflation.
A line above the carpet traces the inflation rate of the median country year by year, and a readout names the highest rate in the year the sweep has reached.
Measuring inflation across 60 years
Consumer price inflation is the yearly percentage change in the cost of a basket of goods and services to the average consumer, measured with a consumer price index. The World Bank publishes the series as the indicator Inflation, consumer prices (annual %), with data starting in 1960, and credits the IMF's International Financial Statistics as its source. The basket may be fixed or revised at intervals, and national methods differ, so the numbers suit broad comparison rather than exact equivalence.
The range of outcomes is enormous. Many central banks in wealthy economies aim for low, stable inflation of around two per cent a year, while episodes of hyperinflation, conventionally defined since Philip Cagan's 1956 work as monthly inflation above 50 per cent, push annual rates into the thousands or far beyond. Deflation, when prices fall, appears as negative values. A colour scale on a heat map has to stretch across all of this at once.
Patterns often reflect shared shocks as much as local ones. Global events such as the oil price rises of the 1970s and the post-pandemic price surge leave visible stripes across many rows. Gaps appear where a country has no reported figure for a year, so a row can be shorter than the others.
A worked example
The median country's inflation peaks at 16.9% in 1974 and is 8.1% in 2022. In 1985 the highest rate anywhere in the data is 11,750%, and in 1990 it is 7,482% — the white-hot stripe along the bottom of the carpet.
Settings & tips
- Speed sets how fast the sweep crosses the years.
- Dark gaps in a row are years with no published figure, not zero inflation.
- Press ESC to leave fullscreen.
Frequently asked questions
- Why is the colour scale logarithmic?
- Inflation ranges from slightly negative to the tens of thousands of percent. On a linear scale everything below about 50% would be the same dark colour and the carpet would look empty.
- Why is Argentina not on it?
- The countries shown must have at least twenty years of data in this World Bank series, and Argentina has only seven. It is a limit of the source, not a judgement about the country.
- What do the dark gaps mean?
- No published figure that year. They are painted as background rather than as 0%, which would be a false claim.
- Where does the data come from?
- The World Bank's consumer-price inflation indicator, measured as the annual percentage change in consumer prices.
- Is inflation measured the same way in every country?
- Broadly, but not identically. Each country's statistics office chooses its own basket, weights and sampling, and the World Bank series is compiled from IMF data, so comparisons are approximate.
- What is hyperinflation?
- A common definition, following economist Philip Cagan, is monthly inflation above 50 per cent. It is usually tied to severe fiscal or political crises and erodes savings and the use of the local currency.
- Why is a median line more useful than an average?
- A few extreme cases can drag an average far above what most countries experience, while the median shows the typical country's inflation without being dominated by outliers.