Canadian Inflation Screensaver
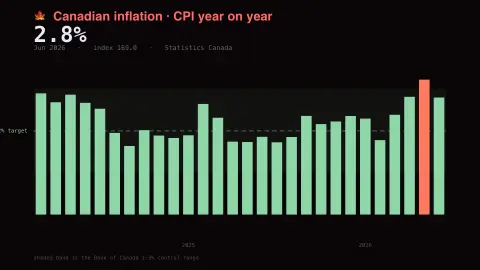
The Canadian Inflation screensaver shows statistics Canada's Consumer Price Index month by month, key-less. It's free, runs in your browser, and ESC exits.
Live preview
Press ESC to leave fullscreen. Settings are saved in your browser only.
How the Canadian Inflation screensaver works
The saver reads the source described above and draws it on a canvas — no account, no tracking.
Statistics Canada's Consumer Price Index month by month, key-less. As with the site's US and euro-area inflation savers, the bars show the year-on-year change rather than the index level, which is the number people mean when they say inflation.
It refreshes on a schedule, so what you see stays current.
Colours and any options can be changed in settings; nothing is stored beyond your own browser.
How Canada measures inflation
Statistics Canada, the national statistical agency, publishes the Consumer Price Index each month. It tracks the cost of a fixed basket of goods and services bought by households, covering things like food, shelter, transport and clothing. Weights come mainly from the Survey of Household Spending, and the basket has been updated annually since the 2021 update. The index level is set against a reference period, but the number commonly discussed is the percentage change from the same month a year earlier.
That year-on-year change in total CPI is how the Bank of Canada measures its target. Its monetary policy aims to keep inflation at 2 percent, the midpoint of a control range of 1 to 3 percent, which is the band the saver compares readings against. Because total CPI includes volatile items, the bank also looks at core measures, CPI-trim, CPI-median and CPI-common, which are published separately and not shown here.
The index measures an average household basket, so your own inflation can differ if you rent, drive or buy different things from the average. Year-on-year figures also contain base effects: a sharp price rise a year ago can lower today’s rate even if prices are still climbing. Figures are published with a delay after the end of the reference month.
A worked example
Statistics Canada's Consumer Price Index month by month, key-less. As with the site's US and euro-area inflation savers, the bars show the year-on-year change rather than the index level, which is the number people mean when they say inflation.
Settings & tips
- Accent and Background recolour the display.
- Every number on screen comes from the live source — nothing is simulated.
- Press ESC to leave fullscreen.
Frequently asked questions
- Is this real data?
- Yes — it comes from the source named on this page and is refreshed on a schedule.
- Is a key needed?
- No. This source is fully key-less.
- Is it free?
- Yes — free, no download, in your browser.
- What is the target range?
- The Bank of Canada aims for 2 percent inflation, the midpoint of a 1 to 3 percent inflation-control range.
- Why can inflation fall while prices keep rising?
- The rate compares with a year earlier, so prices can still rise each month while the yearly rate declines, as long as they rise more slowly than before.