What Money Is Losing Screensaver
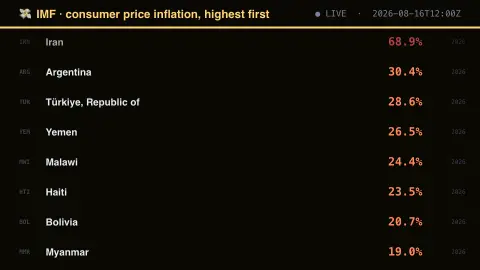
The What Money Is Losing screensaver shows consumer-price inflation by country, key-less from the IMF DataMapper. The API publishes its forecast horizon in the same object as its observations with nothing marking the boundary, so taking the last year with a number in it returns a 2031 projection; the pipeline caps at the current year and draws the reporting year beside each rate. It's free, runs in your browser, and ESC exits.
Live preview
Press ESC to leave fullscreen. Settings are saved in your browser only.
How the What Money Is Losing screensaver works
The saver reads the source described above and draws it on a canvas — no account, no tracking.
Consumer-price inflation by country, key-less from the IMF DataMapper. The API publishes its forecast horizon in the same object as its observations with nothing marking the boundary, so taking the last year with a number in it returns a 2031 projection; the pipeline caps at the current year and draws the reporting year beside each rate.
It refreshes on a schedule, so what you see stays current.
Colours can be changed in settings; nothing is stored beyond your own browser.
Reading inflation figures from the IMF
Consumer-price inflation measures how fast the prices of a typical basket of consumer goods and services rise, expressed as an annual percentage. The IMF’s DataMapper carries the World Economic Outlook series for inflation based on the average consumer price index, where the rate is the percent change in that average. Because the IMF also publishes projections, one dataset can hold both reported results and forecasts side by side.
A rate of 10 percent means the average price level is ten percent higher than the year before. Rates rank countries by how quickly purchasing power erodes, but they compress several realities: the basket differs from country to country, official statistics can be disputed, and the measured figure may differ from what households experience.
Reporting years also differ, which is why each rate here carries its year. The newest figure for a country may not be for the same year as its neighbour’s, and recent figures are often estimates that are revised between World Economic Outlook editions. Very high rates are unusual and typically signal severe economic stress; low or even negative rates can reflect weak demand rather than good news.
A worked example
Consumer-price inflation by country, key-less from the IMF DataMapper. The API publishes its forecast horizon in the same object as its observations with nothing marking the boundary, so taking the last year with a number in it returns a 2031 projection; the pipeline caps at the current year and draws the reporting year beside each rate.
Settings & tips
- Accent and Background recolour the display.
- Every value on screen comes from the live source — nothing is simulated.
- Press ESC to leave fullscreen.
Frequently asked questions
- Is this real data?
- Yes — it comes from the source named on this page and is refreshed on a schedule.
- Is a key needed?
- No. This source is fully key-less.
- Is it free?
- Yes, and it runs entirely in your browser.
- What does inflation of 100 percent mean?
- It means the average price level roughly doubled over the period measured, so money buys about half as much as a year earlier.
- Why might a country's official rate differ from what people feel?
- Official inflation tracks an average basket, but households spend differently. Where statistics are limited or contested, the official figure can also differ from independent estimates.
- Are the numbers final?
- Not always. The most recent years are often estimates or projections, and the IMF revises its series between World Economic Outlook editions as better data arrives.