Heat Index Screensaver
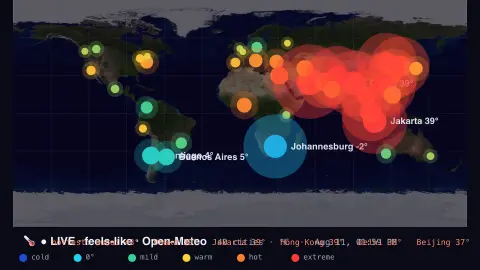
The Heat Index screensaver is a live world map of the apparent temperature — how hot or cold it actually feels with humidity and wind — glowing blue to red across major cities, from the key-less Open-Meteo API. It's free, runs in your browser, and ESC exits.
Live preview
Press ESC to leave fullscreen. Settings are saved in your browser only.
How the Heat Index screensaver works
The saver asks Open-Meteo for the apparent (feels-like) temperature at a built-in list of major world cities, including Toronto, Vancouver, Montréal and Calgary.
Each city is plotted on a world map as a glowing dot colored from deep blue when it feels frigid to red when it feels dangerously hot.
Dots grow at the extremes — both blistering heat and biting cold — so the day's hot and cold spots stand out.
It refreshes every few minutes so the map tracks the warming and cooling through the day.
From temperature to what the body feels
Apparent temperature is an attempt to express how warm or cold the air feels to a person. Open-Meteo describes its version as a perceived feels-like temperature combining wind chill, relative humidity and solar radiation. In hot weather humidity matters because sweat evaporates more slowly in humid air, so the body sheds heat less effectively and the same thermometer reading feels hotter. In the cold, wind speeds up heat loss, which is the idea behind wind chill.
Several formulas exist. The US National Weather Service heat index traces to Robert Steadman’s 1979 paper, which summarised temperature and humidity results as a table; Lans Rothfusz later fitted a regression equation to it in a 1990 technical attachment. Its chart values assume shade, and direct sunlight can raise the value by up to 15°F. Open-Meteo combines output from national weather services and models, so its apparent temperature is a model value, not a thermometer reading from the street.
These numbers are generalisations. The heat index regression cannot be applied outside the range of conditions Steadman studied, and clothing, age, fitness and acclimatisation change how someone experiences a given day. A city value describes a single point, not a whole metropolitan area. For health decisions, official local warnings should be consulted instead.
A worked example
In a summer heatwave you'll see Phoenix glaring red at a feels-like 46° while a Canadian winter night turns Calgary deep blue — the labelled hottest and coldest cities calling out the extremes.
Settings & tips
- Units switches between Celsius and Fahrenheit.
- Refresh sets how often the readings update.
- Background sets the map backdrop.
Frequently asked questions
- Is the data live?
- Yes. The feels-like temperature for every city comes live from Open-Meteo and refreshes every few minutes.
- What is apparent temperature?
- It's how hot or cold it actually feels once humidity, wind and sun are factored in — often quite different from the raw thermometer reading.
- Does it need a key?
- No. Open-Meteo is free and key-less; the saver only needs an internet connection.
- Which cities are shown?
- A built-in spread of major world cities across every continent, including several Canadian cities.
- Is it free?
- Yes — free, no download, in your browser.
- Is the map the same as the National Weather Service heat index?
- Not exactly. The map uses Open-Meteo's apparent temperature, which combines wind chill, humidity and solar radiation, while the NWS heat index is calculated from air temperature and relative humidity.
- Why does humidity make heat feel worse?
- Sweating cools the body only when it evaporates. High humidity slows evaporation, so more heat stays in the body.
- Is a forecast model value the same as a station reading?
- No. Weather models estimate conditions on a grid, so a figure may differ from a thermometer at a specific site, especially near coasts, hills or dense urban areas.