Grid Mix Screensaver
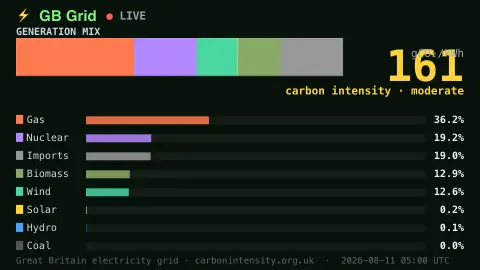
The Grid Mix screensaver is a live dashboard of Britain's electricity generation mix — wind, solar, nuclear, gas and more — with the grid's real-time carbon intensity, from the key-less National Grid Carbon Intensity API. It's free, runs in your browser, and ESC exits.
Live preview
Press ESC to leave fullscreen. Settings are saved in your browser only.
How the Grid Mix screensaver works
The saver fetches Great Britain's live generation mix and carbon intensity from the National Grid's key-less Carbon Intensity API.
Each fuel — wind, solar, nuclear, gas, biomass, hydro, imports and coal — is drawn as a labelled, colored share of the grid.
A big readout shows the current carbon intensity in grams of CO2 per kilowatt-hour, colored from green when clean to red when dirty.
The bars ease to new values as the mix shifts through the day and the data refreshes every few minutes.
Great Britain's electricity mix and carbon intensity
The carbon figures come from the Carbon Intensity API, developed by the National Energy System Operator (NESO, formerly National Grid ESO) with Environmental Defense Fund Europe, the University of Oxford's Department of Computer Science and WWF. It produces forecasts at 30-minute resolution, refreshed every 30 minutes, estimating the carbon dioxide emitted per unit of electricity across Great Britain.
The method combines machine learning models that predict demand and generation by fuel type with AC power flow modelling of a reduced Great Britain network. It covers interconnector imports, so electricity brought in from other countries is included in the figures, and it accounts for embedded wind and solar generation, which is power produced on local distribution networks rather than at large power stations.
Carbon intensity is reported in grams of CO2 per kilowatt-hour and changes through the day as demand and the supply mix change. The national figure is an average for Great Britain and says nothing about the electricity at your own socket. The service also provides forecasts for 14 regions based on distribution network areas. The data cover Great Britain, so Northern Ireland, which is outside the GB grid, is not included.
A worked example
On a blustery afternoon wind might supply half the grid, the carbon figure glowing green; on a still evening gas takes over and it climbs into the amber — the bars sliding to each new mix as Britain's power changes through the day.
Settings & tips
- Show carbon intensity toggles the gCO2/kWh readout.
- Accent recolours the dashboard highlights.
- Background sets the panel backdrop.
Frequently asked questions
- Is the grid data live?
- Yes. The generation mix and carbon intensity come live from the National Grid's Carbon Intensity API and refresh every few minutes.
- Which grid does it show?
- Great Britain's electricity grid — the mix of wind, solar, nuclear, gas and other sources powering the country right now.
- Does it need a key?
- No. The Carbon Intensity API is free and key-less; the saver only needs an internet connection.
- What is carbon intensity?
- It's how many grams of CO2 are emitted per kilowatt-hour of electricity — lower when clean sources like wind dominate, higher when gas does.
- Is it free?
- Yes — free, no download, in your browser.
- Why does the mix change from hour to hour?
- Demand rises and falls through the day, and output from wind and solar depends on the weather, so the shares of each fuel move constantly.
- Does the national figure describe my local electricity?
- Not exactly. The headline value is a Great Britain average, though the Carbon Intensity service also publishes forecasts for 14 regions.