Global Wind Map Screensaver
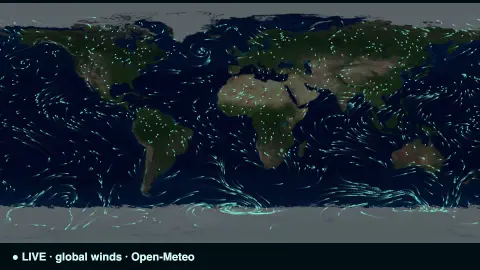
The Global Wind Map screensaver is a living map of the planet's winds, with thousands of particles streaming along the real-time global wind field sampled from the key-less Open-Meteo API. It's free, runs in your browser, and ESC exits.
Live preview
Press ESC to leave fullscreen. Settings are saved in your browser only.
How the Global Wind Map screensaver works
The saver samples wind speed and direction across a global grid of points in a single request to the free Open-Meteo API — no key needed.
Thousands of particles are scattered over a dim world map, each one following the wind vector interpolated from the surrounding grid.
As they drift they leave fading trails, so the screen reveals the great streams and swirls of the planet's weather, like a model flow map.
Particles that wander off are respawned, and the whole field refreshes every few minutes to track the changing winds.
Wind fields, forecast models and grids
The wind shown here is model data. Global weather models divide the atmosphere into a three-dimensional grid and use physics equations plus observations to estimate conditions at each point. Open-Meteo combines output from several national weather services, such as Germany's DWD, NOAA in the United States and ECMWF, behind one API, so the values are model forecast data, not a measurement at each spot.
Wind is a vector, with speed and direction, and meteorologists describe direction by where the wind blows from. Animating particles along those vectors is a common way to show flow: where particles bunch and swirl you see convergence and rotation, and near-parallel tracks reveal steady regimes such as the trade winds.
Resolution is the main caveat. Open-Meteo lists model grids from about 1 km up to 25 km, and global models are at the coarse end of that range, roughly 9 to 25 km. They capture big patterns such as storms and fronts but not local effects like sea breezes, valley winds or gusts around buildings. Open-Meteo's standard wind level is 10 metres above ground, so winds higher up, in the jet stream, are often much faster than a surface display suggests.
A worked example
Trade winds comb steadily across the tropics while jet streams whip in tight ribbons and storms turn in slow spirals — all drawn from the live wind field, the particles tracing the air's real motion across the globe.
Settings & tips
- Particle density sets how many streamers fill the map.
- Flow speed controls how fast the particles travel.
- Wind color recolours the streamers.
Frequently asked questions
- Are the winds real and live?
- Yes. The flow field is sampled live from the Open-Meteo weather model and refreshed every few minutes, so the streams reflect current winds.
- Does it need a key?
- No. Open-Meteo is free and key-less; the saver only needs an internet connection.
- How detailed is the wind field?
- It samples a coarse global grid, so it captures the large-scale streams and swirls beautifully rather than fine local gusts.
- How is this different from Weather Radar?
- Radar shows precipitation over one region; the Wind Map shows the whole planet's air movement as flowing particles.
- Is it free?
- Yes — free, no download, in your browser.
- At what height are surface winds measured?
- By convention, ten metres above ground, and Open-Meteo's standard wind level is 10 m. Winds higher up, in the jet stream, are often much faster.
- What does west wind mean?
- Meteorologists name wind by where it comes from, so a west wind blows from the west toward the east.
- Why can't this tell me the wind in my street?
- Models use grid cells several kilometres across or more, so they smooth over hills, buildings and coastlines that shape wind at street level.