Buoy Report Screensaver
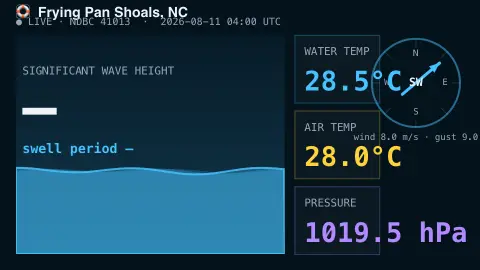
The Buoy Report screensaver is a retro nautical panel of live readings from a NOAA ocean buoy — wave height, swell period, water and air temperature, wind and pressure — gathered from the key-less NDBC network by the pipeline. It's free, runs in your browser, and ESC exits.
Live preview
Press ESC to leave fullscreen. Settings are saved in your browser only.
How the Buoy Report screensaver works
A background pipeline reads the real-time report from your chosen NOAA NDBC buoy, far out at sea, with no key.
The saver shows the significant wave height with an animated wave whose size matches it, plus the dominant swell period.
Water and air temperature, barometric pressure, and the wind direction and speed are laid out on a retro instrument panel.
Readings refresh on a schedule, and any sensor that's offline simply shows a dash.
NOAA's National Data Buoy Center network
The National Data Buoy Center is part of NOAA’s National Weather Service. It describes its network as the world’s largest real-time marine observation network, with about 240 stations including more than 100 moored weather buoys and over 40 land-based C-MAN stations on lighthouses, capes, beaches and platforms. Its stated purpose is to provide data for maritime safety and for understanding and predicting the atmosphere, ocean, waves, ice and climate. Partner organizations and ships also supply observations that NDBC includes.
Moored buoys measure pressure, wind, air and sea temperature and wave data. Significant wave height is roughly the average height, trough to crest, of the highest third of waves, and NDBC computes it as four times the square root of the variance of the wave displacement, taken from the wave spectrum. The dominant period is the period of the frequency band with the highest spectral density. Not every station carries every sensor, which is why entries can be blank.
Standard meteorological observations are reported hourly and carry an observation time, and wave measurements come from a 20-minute sampling period. For buoys, wind speed is averaged over eight minutes. A value is a snapshot of one place, which may be far offshore and not representative of a nearby coast. Anemometer heights vary by buoy, mostly a few metres above the sea surface, and real-time files are distributed as soon as they are received.
A worked example
For the San Francisco buoy you might see 2.1 m @ 11 s swell, a 14°C sea, the wind needle pointing from the northwest, and the barometer steady — a real snapshot from a buoy bobbing miles offshore.
Settings & tips
- Buoy chooses which NOAA station to read.
- Accent recolours the water and instruments.
- Run
automation/run.py buoyon your pipeline machine to refresh the readings.
Frequently asked questions
- Are the readings real?
- Yes. They come straight from NOAA NDBC buoys reporting in real time, refreshed by the pipeline.
- Why is a value sometimes a dash?
- Buoys occasionally have a sensor offline. When a reading is missing the panel shows a dash rather than a wrong number.
- Why does it use a pipeline?
- The NDBC data files aren't readable directly from a browser, so a small background script fetches them and saves a snapshot the saver loads.
- Which buoys can I pick?
- A built-in set including stations off North Carolina, San Francisco, Boston, Hawaii and the Gulf of Mexico.
- Is it free?
- Yes — free, no download, in your browser.
- What is significant wave height?
- It is roughly the average height, trough to crest, of the highest third of the waves in the sampling period. NDBC calculates it as four times the square root of the variance of the wave displacement. The largest individual waves can be considerably taller.
- Why do some stations show only wind and pressure?
- Not every station carries every sensor. Wave sensors in particular are not on all stations, and a sensor that is offline simply leaves a blank.
- How often are buoy reports updated?
- Standard meteorological observations are reported hourly. Each report has a time stamp that tells you when the measurement was made.