Endangered Species Red List Tracker Screensaver
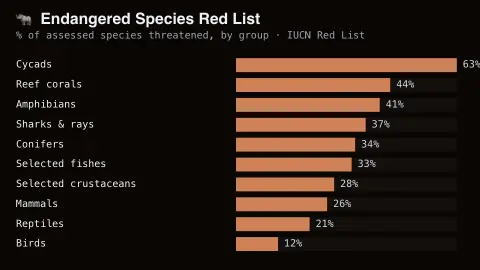
The Endangered Species Red List Tracker screensaver shows real species conservation status by taxonomic group, from the IUCN Red List's own published summary statistics. It is free, runs in your browser, and ESC exits.
Live preview
Press ESC to leave fullscreen. Settings are saved in your browser only.
How the Endangered Species Red List Tracker screensaver works
The saver displays real, published summary statistics from the IUCN Red List of Threatened Species.
Each group shows its real reported share of threatened species, from amphibians to corals.
The board refreshes periodically as the IUCN publishes new real summary statistics.
No live feed is required — figures are a real, curated periodic snapshot.
Reading the IUCN Red List categories
The IUCN Red List of Threatened Species is run by the International Union for Conservation of Nature, which describes itself as a membership Union of government and civil society organisations. It places each assessed species in a category using published criteria. These cover population decline, geographic range, population size and quantitative estimates of extinction probability. The categories run from Least Concern and Near Threatened up through Vulnerable, Endangered and Critically Endangered, with Extinct in the Wild and Extinct at the end.
Threatened has a specific meaning: it covers only Vulnerable, Endangered and Critically Endangered. A share shown for a group such as amphibians or corals is the proportion of assessed species in those categories, not of every species that exists. Species listed as Data Deficient have too little information to place, and published percentages handle them in different ways, for example by excluding them or by treating them as equally threatened as the rest.
Coverage matters too. Statistics are reported for the more completely evaluated groups, and the status of virtually all known birds, mammals and amphibians has been assessed, while other groups are only partly covered. Percentages for those groups can therefore shift when new evaluations are added, even if nothing changed in the wild.
A worked example
A real, widely cited figure like over 40% of assessed amphibian species being threatened appears exactly as published in the IUCN's own summary report.
Settings & tips
- Accent recolours the group bars.
- Figures are real, published IUCN Red List summary statistics.
- The board updates as the IUCN publishes new real assessments.
Frequently asked questions
- Is this real conservation data?
- Yes — real, published summary statistics from the IUCN Red List.
- Is a key needed?
- No — figures are a curated real periodic snapshot.
- What is the IUCN Red List?
- The world's most comprehensive real inventory of species conservation status.
- Is it free?
- Yes — free, no download, in your browser.
- Does 'threatened' mean the same as 'extinct'?
- No. Threatened covers Vulnerable, Endangered and Critically Endangered species that still exist. Extinct is a separate category used when there is no reasonable doubt that the last individual has died.
- Why do percentages for some groups change between updates?
- A group's share depends on which species have been assessed and how they were classed. New evaluations, revised statuses and real changes in the wild can all move it.
- Are all species on the Red List?
- No. It covers only species that have been formally assessed, and some groups are far better covered than others.