El Nino La Nina Index Tracker Screensaver
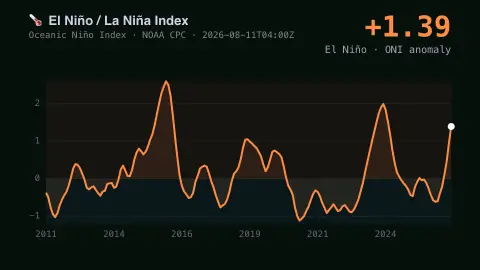
The El Nino La Nina Index Tracker screensaver charts the real Oceanic Nino Index. It is free, runs in your browser, and ESC exits.
Live preview
Press ESC to leave fullscreen. Settings are saved in your browser only.
How the El Nino La Nina Index Tracker screensaver works
The saver reads NOAA's own real published ONI seasonal table.
The chart plots real sea-surface temperature anomalies since 1950.
The current phase is read directly from the real latest reported value.
No key is required for this key-less public data file.
Reading the Oceanic Nino Index
The Oceanic Nino Index, or ONI, is a Climate Prediction Center measure of sea-surface temperature anomalies in the Nino 3.4 region of the equatorial Pacific (5°N–5°S, 120°–170°W). Each value is a three-month running mean, so every row of the table is labelled with a season code such as DJF or JJA, the initials of the three months. An anomaly is the difference from a base-period average, so a value near zero means the ocean is close to its usual temperature for that time of year.
Warm and cold episodes are marked when the index reaches +0.5 °C or more or −0.5 °C or less. CPC colours a period only when that threshold holds for a minimum of five consecutive overlapping seasons, which keeps brief swings from counting as El Nino or La Nina. The chart shows these as warm and cool excursions around the neutral line.
The anomalies are measured against centered 30-year base periods that are updated every five years, and CPC has moved the ONI table to the ERSST version 6 dataset. NOAA notes that the newest values can change for up to two months after first posting, so treat the latest entry as an estimate. NOAA now uses a related index, the Relative Oceanic Nino Index, for official ENSO monitoring and prediction.
A worked example
The real latest three-month seasonal anomaly is plotted at the end of a real seven-decade curve.
Settings & tips
- Every point is a real, unedited NOAA seasonal ONI value.
- Accent recolours the curve and latest-value readout.
- El Nino and La Nina are the real warm and cool ENSO phases.
Frequently asked questions
- Is this real climate data?
- Yes — the real Oceanic Nino Index from NOAA's Climate Prediction Center.
- Is a key needed?
- No. NOAA's ONI data file is fully key-less.
- How far back does it go?
- The real record shown here spans the most recent fifteen years.
- Is it free?
- Yes — free, no download, in your browser.
- What do the season codes like DJF mean?
- They are the first letters of three consecutive months, so DJF is December, January and February. Each value is a three-month running mean.
- How is El Nino told apart from a brief warm spell?
- The index has to reach +0.5 °C or more, and CPC colours a period as an episode only when that holds for at least five consecutive overlapping seasons. La Nina uses the same rule at −0.5 °C or lower.
- Why can values change?
- Recent values can change for up to two months after they are first posted, and the base periods used for the anomalies are updated every five years.