Pollen Count Screensaver
The Pollen Count screensaver shows real current pollen concentrations and the European air-quality index for a city you choose, read key-less from Open-Meteo. It's free, runs in your browser, and ESC exits.
Live preview
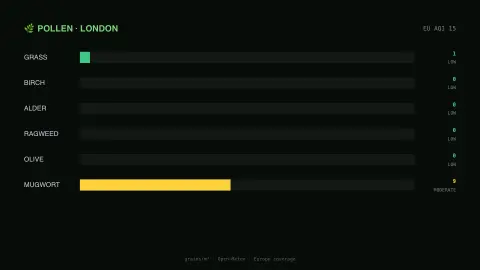
Press ESC to leave fullscreen. Settings are saved in your browser only.
How the Pollen Count screensaver works
Pick a city and the saver reads current pollen concentrations directly from Open-Meteo's key-less air-quality API.
Six pollen types are shown as bars scaled against published "high" thresholds, so colour signals severity, not just length.
The European air-quality index is shown alongside for general air conditions.
It refreshes every half hour. Pollen coverage is Europe-only, so the city list is European.
Modelled pollen and why it differs from a trap count
Traditional pollen counts come from physical traps. A sampler draws air onto a sticky surface, and a trained analyst identifies and counts the grains under a microscope, then reports grains per cubic metre of air. This is accurate but slow and costly, with results often available only a day or more later and only near sampling sites.
The values here are modelled concentrations from Open-Meteo, based on the CAMS European air quality forecast from the Copernicus Atmosphere Monitoring Service. Open-Meteo gives pollen in grains per cubic metre at about 11 km grid resolution, hourly, for alder, birch, grass, mugwort, olive and ragweed, and only for Europe during pollen season. It is a forecast, not a measurement, and it can differ from what a local trap records.
Species matter. Tree pollen peaks in spring, grass in late spring and summer, and weeds such as ragweed later on, so a bar's meaning changes through the year. Individual sensitivity varies enormously, and a number that leaves one person untroubled may affect another. This is general information and not medical advice; anyone with allergy concerns should speak to a clinician or pharmacist.
A worked example
On a June morning in London the grass bar runs orange at HIGH while birch and alder sit flat at zero — the seasonal pattern any hay-fever sufferer would recognise, straight from real measurements.
Settings & tips
- City switches location; coverage is European.
- Bar colour follows published low/moderate/high/very-high thresholds per pollen type.
- Counts are in grains per cubic metre.
Frequently asked questions
- Is this real pollen data?
- Yes — real modelled concentrations from Open-Meteo's air-quality API, refreshed every half hour.
- Why are only European cities listed?
- The underlying pollen model covers Europe only, so offering other cities would show empty data.
- What do the colours mean?
- Each bar is scaled against that pollen type's published "high" threshold, so green is low, yellow moderate, orange high and red very high.
- Is a key needed?
- No. Open-Meteo is fully key-less.
- Is it free?
- Yes — free, no download, in your browser.
- How is a pollen count normally measured?
- A sampler collects airborne particles and a person counts the grains under a microscope, giving grains per cubic metre. Modelled values estimate the same quantity without a physical trap.
- Why can model values differ from my local forecast?
- Local forecasts may use trap data from a specific site, while model values are gridded estimates about 11 km across that can miss local vegetation and microclimate.
- Why do some pollen types read zero?
- Each plant releases pollen in its own season, and Open-Meteo provides pollen only during the European pollen season, so many types are absent at certain times of year.