Rooftop Solar Yield Screensaver
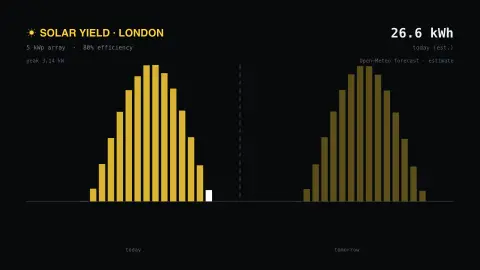
The Rooftop Solar Yield screensaver shows the real solar-radiation forecast for a city you choose, read key-less from Open-Meteo and turned into the generation curve a rooftop array of the size you set would follow today and tomorrow. It's free, runs in your browser, and ESC exits.
Live preview
Press ESC to leave fullscreen. Settings are saved in your browser only.
How the Rooftop Solar Yield screensaver works
The saver reads Open-Meteo directly in your browser — no key and no account.
The real solar-radiation forecast for a city you choose, read key-less from Open-Meteo and turned into the generation curve a rooftop array of the size you set would follow today and tomorrow..
It refreshes on a schedule, so what you see stays current.
Colours and the accent can be changed in settings; nothing is stored beyond your own browser.
How solar output is estimated from the weather
Open-Meteo is a weather API that combines output from national weather services, such as Germany’s DWD, NOAA, ECMWF and the UK Met Office, into one continuous time series and picks the highest-resolution model available for each location. Among its variables is shortwave radiation, which it defines as equal to total global horizontal irradiation, given in watts per square metre as the mean over the preceding hour. Direct and diffuse radiation are offered separately.
Turning irradiance into power requires assumptions. A rooftop array’s output depends on its size, panel efficiency, tilt and orientation, and on losses in the inverter and wiring. Open-Meteo can also provide global tilted irradiance for a given tilt and azimuth, though it assumes a fixed 20% ground albedo and an isotropic sky. The curve here applies a simple model to the forecast for the array size you choose, so the result is a rough estimate, not a measurement or an engineering design.
Cloud is the main uncertainty in the forecast: a passing cloud can cut instantaneous output sharply, while a clear day gives a smooth bell-shaped curve. Local shading from trees or buildings, snow cover and dirt on panels are not modelled. For a real installation, an installer’s site assessment will give better figures than any generic estimate.
A worked example
The real solar-radiation forecast for a city you choose, read key-less from Open-Meteo and turned into the generation curve a rooftop array of the size you set would follow today and tomorrow.
Settings & tips
- Accent and Background recolour the display.
- Data comes straight from Open-Meteo in your browser.
- Press ESC to leave fullscreen.
Frequently asked questions
- Is this real data?
- Yes — it comes from Open-Meteo and is refreshed on a schedule.
- Is a key needed?
- No. This source is fully key-less.
- Does it need an internet connection?
- Yes — it reads a live source, so it needs a connection to update.
- Is it free?
- Yes — free, no download, in your browser.
- Why is the curve shaped like a bell?
- Sunlight reaches its peak around solar noon and falls toward sunrise and sunset, so output rises and falls over the day. Clouds make the real curve more jagged.
- What is irradiance?
- It is the power of sunlight arriving per unit area, measured in watts per square metre, and it is the main driver of how much a solar panel produces.
- Does the estimate include shading and snow?
- No. The model uses the weather forecast and a simple array assumption, so local shading, snow and dirt on panels are not accounted for.