Day-Ahead Power Price Curve Screensaver
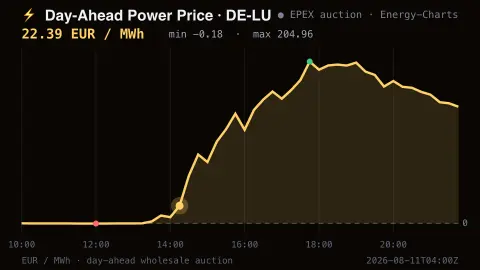
The Day-Ahead Power Price Curve screensaver draws the real EPEX day-ahead auction price curve for the Germany–Luxembourg bidding zone, from Energy-Charts (Fraunhofer ISE) — the price twin of this site's Duck Curve demand chart. It's free, needs an internet connection, and ESC exits.
Live preview
Press ESC to leave fullscreen. Settings are saved in your browser only.
How the Day-Ahead Power Price Curve screensaver works
A pipeline script fetches the real EPEX day-ahead auction results for the DE-LU zone from Energy-Charts (Fraunhofer ISE) into content/dayaheadprice.json.
The saver plots the whole published window as a price curve in EUR / MWh, with hour gridlines like a trading desk chart.
Prices can go negative around solar midday — when they do, a dashed zero line appears and the below-zero area is filled red.
A pulsing dot marks the interval closest to your clock, and the headline shows that price plus the day's min and max.
Inside the day-ahead electricity auction
Wholesale electricity in Europe is largely traded the day before delivery in a coupled auction. Participants submit bids for each delivery period of the following day, and a shared algorithm, Euphemia, matches supply and demand while respecting cross-border grid limits. The result is a clearing price for each bidding zone and delivery period; here the zone is Germany and Luxembourg, with EPEX SPOT as the exchange. Bids for the auction close at 12:00 CET on the day before.
Since 1 October 2025 EPEX SPOT's coupled day-ahead markets have used 15-minute delivery periods, so a day is made of 96 intervals rather than 24 hourly prices. The price is quoted in euros per megawatt-hour and is a wholesale price, not what households pay: a retail bill also includes network charges, taxes and supplier costs.
The curve's shape reflects what is on the grid. When wind and solar output is high and demand low, prices can fall toward zero or below. When demand is high and more expensive plants are needed, they climb. Intraday and balancing trading happens after this auction, so the day-ahead curve shows planned prices, not metered outcomes.
A worked example
On a sunny Sunday the curve can dip below zero at 13:00 — producers effectively paying to offload power — then spike past 180 EUR / MWh into the 20:00 evening ramp. Pair it with the Duck Curve saver in Multi-view to watch demand and price side by side.
Settings & tips
- Show min/max markers — dots the day's cheapest interval in red and its most expensive in green, so the extremes pop at a glance.
Frequently asked questions
- Are these real electricity prices?
- Yes. They're the actual day-ahead auction results for the DE-LU bidding zone on EPEX, republished by Energy-Charts, a project of Fraunhofer ISE. Auction prices are set once per day, so the curve updates daily rather than tick by tick.
- Does it need an API key?
- No. Energy-Charts is key-less; the site's pipeline gathers the data into a small JSON feed that the saver reads.
- Why do prices go negative?
- When solar and wind flood the market at midday, producers can bid below zero — paying buyers to take power rather than shut plants down. The saver fills those stretches red below a zero line.
- Does it work offline?
- No. It needs an internet connection to read the feed; offline it shows a short notice instead of stale numbers.
- Is it free?
- Yes — free, no download, in your browser. ESC exits.
- Is the day-ahead price what my electricity costs per kWh?
- No. It is a wholesale price per megawatt-hour, and a household tariff includes grid fees, taxes and supplier costs. Dividing by 1,000 gives a rough per-kWh figure for the energy component alone.
- What does a bidding zone mean?
- A bidding zone is an area of the grid that gets one price in the auction. Germany and Luxembourg are treated together as the DE-LU zone shown here.
- Does the day-ahead price change after the auction?
- The auction result is the price for that day-ahead market. Later trading in the intraday and balancing markets has its own prices.