Soil Moisture Screensaver
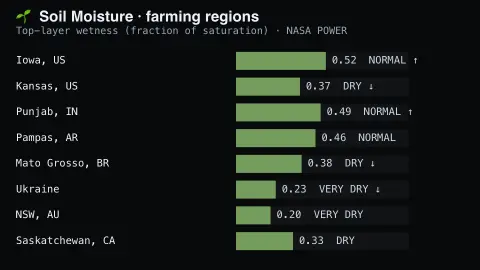
The Soil Moisture screensaver shows real top-layer soil wetness for major farming regions from NASA's key-less POWER dataset — a fraction of saturation, where 0 is bone dry and 1 is fully saturated. It's free, runs in your browser, and ESC exits.
Live preview
Press ESC to leave fullscreen. Settings are saved in your browser only.
How the Soil Moisture screensaver works
The background pipeline reads this from NASA POWER and saves a snapshot the saver loads.
Real top-layer soil wetness for major farming regions from NASA's key-less POWER dataset — a fraction of saturation, where 0 is bone dry and 1 is fully saturated..
It refreshes on a schedule, so what you see stays current.
Colours and the accent can be changed in settings; nothing is stored beyond your own browser.
What soil wetness measures, and where it comes from
NASA POWER, short for Prediction Of Worldwide Energy Resources, supplies solar and meteorological data from satellite observations and models, with renewable energy, sustainable buildings and agroclimatology as its focus areas. Its meteorological data are drawn from MERRA-2, a NASA global reanalysis, which assimilates observations into a gridded model of the atmosphere and land. Soil wetness values are therefore modelled, not read from probes in fields.
The figure here describes the top layer of soil as a fraction of saturation, so 0 means bone dry and 1 means fully saturated. Each farming region carries a current wetness, an avg baseline and a trend showing whether the latest reading sits above or below that baseline. A negative trend means drier than that region’s own norm, which is not the same as dry in absolute terms.
Because the values are gridded on a grid of roughly half a degree of latitude by five-eighths of a degree of longitude, a region marker stands for a model cell tens of kilometres wide, not a particular field. The surface layer says little about the deeper root zone that plants draw on, which POWER reports as a separate parameter.
A worked example
Real top-layer soil wetness for major farming regions from NASA's key-less POWER dataset — a fraction of saturation, where 0 is bone dry and 1 is fully saturated.
Settings & tips
- Accent and Background recolour the display.
- Run
automation/run.py soilmoistureto refresh the feed. - Press ESC to leave fullscreen.
Frequently asked questions
- Is this real data?
- Yes — it comes from NASA POWER and is refreshed on a schedule.
- Is a key needed?
- No. This source is fully key-less.
- Does it need an internet connection?
- Yes — it reads a live source, so it needs a connection to update.
- Is it free?
- Yes — free, no download, in your browser.
- Does 0.56 mean the soil is 56 percent water?
- No. It is a fraction of saturation for the top layer, so 0.56 means the pore space is a little over half full, not that water makes up that share of the soil.
- Why would a wet region have a negative trend?
- The trend compares the latest reading with that region's own average. A soil can still be fairly wet yet be drier than usual.
- Is this the same as drought monitoring?
- No. Drought monitoring typically draws on rainfall, temperature, vegetation and longer time windows, whereas this shows only modelled surface wetness.