Grid Battery Storage Growth Screensaver
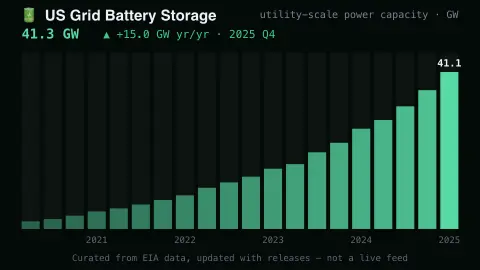
The Grid Battery Storage Growth screensaver draws cumulative US utility-scale battery power capacity as ascending quarterly bars, curated from the EIA's published figures — from under 2 GW in early 2021 to about 41 GW by the end of 2025. It's free, works fully offline, and ESC exits.
Live preview
Press ESC to leave fullscreen. Settings are saved in your browser only.
How the Grid Battery Storage Growth screensaver works
A real quarterly series of cumulative US utility-scale battery capacity (GW) is embedded in the saver, anchored to figures the EIA has published — Form EIA-860M reporting and its Today in Energy articles.
Quarters between published anchor values are interpolated, and the series is refreshed by hand when new EIA releases land — the on-screen footnote says exactly that.
The bars ease upward in a staggered sweep when the saver starts, brightening toward the newest quarter.
The headline shows the latest cumulative GW and the year-over-year jump — recently around +15 GW yr/yr.
Why grid batteries are measured in gigawatts
Utility-scale batteries are large installations connected directly to the electricity grid. In the United States, the Energy Information Administration tracks them through its monthly generator survey, Form EIA-860M, which covers existing and proposed generating units at plants with 1 megawatt or more of combined nameplate capacity. That is how battery projects get counted alongside other power plants.
Battery capacity can be quoted two ways, and they answer different questions. Power capacity, in megawatts or gigawatts, is the maximum power a battery can deliver at any instant. Energy capacity, in megawatt-hours, is the total energy it can store or discharge. Dividing energy by power gives the duration: a 2 MWh battery rated at 1 MW can run at full power for 2 hours. Gigawatts alone therefore do not say how much energy is stored.
This series tracks power capacity only, for large grid-connected systems. It does not include home batteries, backup systems behind a customer's meter, or electric-vehicle packs, and capacity that is only proposed is not part of the operating total. EIA's own analyses of batteries distinguish operating units from planned ones for exactly this reason.
A worked example
At the full 20-quarter window the shape tells the story on its own: bars crawl through 2021–22, bend upward through 2023, then leap as the fleet grows from 26.3 GW at end-2024 to about 41 GW a year later. Run it beside the Day-Ahead Power Price Curve in Multi-view to see why midday prices keep going negative.
Settings & tips
- Quarters shown — how much history to draw, from the last 8 quarters to the full series back to 2021.
Frequently asked questions
- Is this real data?
- Yes, with an honest caveat: the anchor figures are the EIA's own published capacity numbers, and quarters between anchors are interpolated. The footnote on screen says it's curated from EIA data, not a live feed.
- Does it update automatically?
- No. The series is baked into the saver and updated by hand when the EIA publishes new figures, so it's always slightly behind the very latest release.
- Does it work offline?
- Yes. The data is embedded, so there's no network fetch at all — it runs entirely offline.
- Is it free?
- Yes — free, no download, no key, in your browser. ESC exits.
- Is this power or energy capacity?
- Power capacity, in gigawatts — the maximum instantaneous output. Energy capacity (gigawatt-hours) runs higher still, since most grid batteries store several hours of output.
- What is the difference between a battery's MW and MWh?
- MW is the maximum power a battery can deliver at one instant, while MWh is the total energy it can store or discharge. Dividing MWh by MW gives the duration in hours at full output.
- Do these figures include rooftop or home batteries?
- No. The series is for utility-scale systems connected to the grid, and EIA's generator survey covers plants of 1 megawatt or more. Small behind-the-meter batteries are not part of it.
- Does a bigger gigawatt number mean more stored energy?
- Not necessarily. Gigawatts measure power, not stored energy. Two fleets with the same power rating can hold very different amounts of energy if their durations differ.