Education Spending Board Screensaver
The Education Spending Board screensaver ranks countries by government expenditure on education as a percentage of GDP, live from the World Bank's open data API. It's free, needs an internet connection, and ESC exits.
Live preview
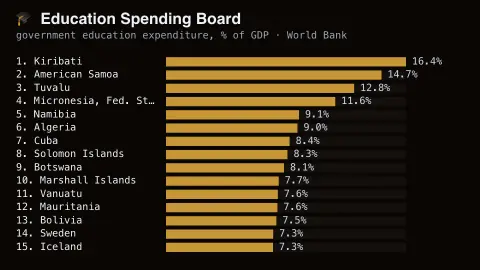
Press ESC to leave fullscreen. Settings are saved in your browser only.
How the Education Spending Board screensaver works
The saver calls the World Bank's key-less open data API for government education expenditure (SE.XPD.TOTL.GD.ZS) with mrnev=1, so each bar is that country's most recent published figure.
Region and income aggregates are filtered out using the World Bank's own country metadata, leaving only real countries.
Countries are ranked by spending share and each bar eases toward its real value, formatted to one decimal place.
It refreshes hourly; the underlying UNESCO-sourced figures update on the World Bank's own schedule.
Reading education spending as a share of GDP
Spending on education as a percentage of GDP is one of the standard yardsticks for how much of a country's economic output goes to public education. The World Bank series divides total government expenditure on education, across all levels of education, by gross domestic product, with local, regional and central government counted as general government. The data in the World Bank's indicator database come from the UNESCO Institute for Statistics.
Because it is a ratio, the measure says nothing about how much is spent per pupil. A wealthy country can spend a modest share of a very large economy and still outspend a poorer country that commits a bigger slice of a small one. UNESCO's Education 2030 Framework for Action uses this same measure for a benchmark, suggesting countries aim for at least 4 to 6 percent of GDP, which shows how widely the ratio is used for comparison.
Reporting is uneven. Some governments submit figures every year while others appear only occasionally, so neighbouring bars on the board can come from different years. Countries also differ in how fully their national accounts capture education spending, so small gaps between countries are better read as rough tiers than exact rankings.
A worked example
Small island states dominate the top — Kiribati spends over 16% of GDP on education, several times the global norm of 3–5% — while some large economies sit below 1%. Run it beside the Literacy Rate Board in Multi-view to watch inputs against outcomes.
Settings & tips
- Countries shown — how many ranked rows to display (10–25).
- The measure is general government spending on education as a share of GDP, so small-GDP states can rank far above rich ones in absolute spend.
- Data years differ by country — each is the most recent the World Bank has published.
Frequently asked questions
- Is this real data?
- Yes — real government education expenditure figures (UNESCO Institute for Statistics data) fetched live from the World Bank's official open data API.
- Is a key needed?
- No. The World Bank open data API is public, key-less and CORS-enabled, so the browser calls it directly.
- Does it work offline?
- No. It fetches live from the World Bank, so it needs an internet connection; offline it shows a short notice.
- Is it free?
- Yes — free, no download, in your browser.
- Why do tiny countries top the board?
- The indicator is spending relative to GDP. Island microstates with small economies and big public sectors — Kiribati, Tuvalu, Micronesia — outrank wealthy countries that spend far more in absolute dollars.
- Does a higher bar mean better schools?
- Not necessarily. The ratio captures how much of national income goes to education, not how efficiently it is spent or what students learn, so outcomes depend on much more than the share.
- Does this include private spending on tuition?
- The indicator is built from government expenditure, so fees paid by households are generally outside it. Countries with large private school sectors can look lower than their total investment suggests.