Net Migration Board Screensaver
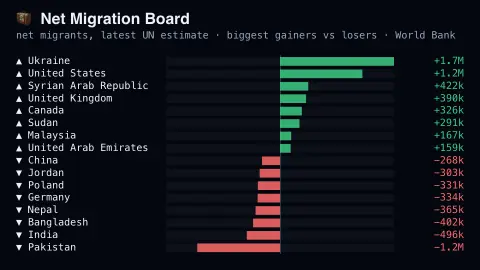
The Net Migration Board screensaver shows a diverging board of net migration by country — the biggest gainers grow green bars to the right, the biggest losers red bars to the left — from the World Bank's open data API. It's free, needs an internet connection, and ESC exits.
Live preview
Press ESC to leave fullscreen. Settings are saved in your browser only.
How the Net Migration Board screensaver works
The saver calls the World Bank's key-less open data API for the net migration indicator (SM.POP.NETM) with mrnev=1, so each country reports its most recent published value.
Region and income aggregates are filtered out using the World Bank's own country metadata, leaving only real countries.
Gainers and losers extend from a shared centre baseline — green bars right for net inflows, red bars left for net outflows — with values like +1.7M and -340k.
It refreshes hourly; the underlying UN-derived estimates update on the World Bank's own schedule.
How net migration is estimated
Net migration is the number of people who moved into a country minus those who left over a period. The World Bank series used here, code SM.POP.NETM, comes from the United Nations Population Division’s World Population Prospects. The sign tells you the direction: positive means more arrivals than departures, negative the reverse.
Few countries count migrants directly at every border. The Population Division notes that most countries do not directly measure migration, and that estimating it as a residual from population totals, births and deaths is vulnerable to errors in those inputs. That means the numbers are model-based estimates with real uncertainty, and countries with weak registration systems or large irregular flows are the hardest to pin down.
Absolute numbers favour big countries, so a large economy can top either end of the board without having a high rate relative to its population. A negative value does not necessarily signal hardship at home; it can reflect workers abroad or a conflict, and the cause behind a bar is not part of the data. Each new edition of the UN estimates revises earlier figures, so past values can shift.
A worked example
On current data Ukraine leads the gainers at about +1.7M (returnees), the United States follows at +1.2M, while Pakistan anchors the losers at about -1.2M. In Multi-view it pairs naturally with the World GDP and Median Age boards.
Settings & tips
- Rows per side — how many top gainers and top losers to show (4–10 each).
- Positive values are green and grow rightward; negative values are red and grow leftward from the centre line.
- Net migration is immigrants minus emigrants in the year — a small number can still mean huge flows in both directions.
Frequently asked questions
- Is this real data?
- Yes — the World Bank's net migration indicator, derived from UN Population Division estimates, fetched live from the official open data API.
- Is a key needed?
- No. The World Bank open data API is public, key-less and CORS-enabled, so the browser calls it directly.
- Does it work offline?
- No. It fetches live from the World Bank, so it needs an internet connection; offline it shows a short notice.
- Is it free?
- Yes — free, no download, in your browser.
- Why can net migration be negative?
- It's arrivals minus departures. Countries with large emigrant workforces — Pakistan, India, Bangladesh — show negative values because more people leave than arrive in the year.
- Does the board include refugees?
- The indicator is a single net figure of people moving in minus people moving out, so it is not split into migrants and refugees. Check the UN World Population Prospects documentation for how refugee movements are treated.
- Why are countries with big populations often at the extremes?
- The measure is a count rather than a rate, so large countries produce larger totals for the same proportional flow. A per-capita view would rank different countries.