Median Age Board Screensaver
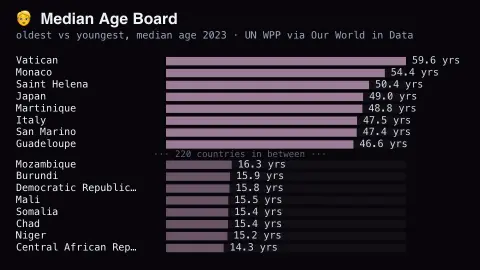
The Median Age Board screensaver shows the world's oldest and youngest populations side by side — half the board is the highest median ages, half the lowest — parsed browser-direct from Our World in Data's UN World Population Prospects dataset. It's free, needs an internet connection, and ESC exits.
Live preview
Press ESC to leave fullscreen. Settings are saved in your browser only.
How the Median Age Board screensaver works
The saver downloads Our World in Data's median-age.csv grapher file (about 1MB, key-less and CORS-enabled) straight into the browser.
It keeps only observed values — rows with a real Median age figure and a 3-letter ISO code — and takes each country's latest year, currently 2023; the projections column is ignored.
The top half of the board is the oldest societies, the bottom half the youngest, with a divider counting the countries skipped in between.
It refreshes hourly, though the UN dataset itself is revised only every couple of years.
What median age says about a population
The median age is the age that splits a population into two equal halves: half of the people are younger and half are older. It is a convenient single number for the age structure of a country, and it is less distorted by a few very old residents than the average age would be. The figures on this board come from the United Nations World Population Prospects, which Our World in Data republishes.
World Population Prospects is produced by the UN Population Division and revised roughly every two to three years; the 2024 revision gives annual counts through 2023 for 237 countries and territories. The Division builds its estimates with a cohort-component method that keeps changes by age and sex consistent with assumed fertility, mortality and net migration, drawing on over 1,900 national censuses and thousands of surveys.
Median age mostly reflects fertility and longevity: high birth rates push it down, while longer lives and low birth rates push it up. Because the estimates rest on censuses and surveys, places with infrequent or weak data carry more uncertainty. The number also says nothing about the spread, since a country may have many young adults and many elderly at once.
A worked example
The contrast is the point: Japan and Italy sit near 48–49 years while Niger and the Central African Republic are under 16 — a three-decade gap in the age of the typical person. Run it beside the Net Migration Board in Multi-view and the demographic story tells itself.
Settings & tips
- Rows per side — how many countries to show in each half (4–12).
- The oldest half draws in a stronger accent tone than the youngest half, so the two blocks read at a glance.
- Entries include territories with ISO codes — Vatican, Monaco and Saint Helena legitimately top the oldest list.
Frequently asked questions
- Is this real data?
- Yes — median age estimates from the UN's World Population Prospects, served by Our World in Data's public grapher CSV and parsed in your browser.
- Is a key needed?
- No. The Our World in Data CSV endpoint is public, key-less and CORS-enabled.
- Does it work offline?
- No. It downloads the CSV from Our World in Data, so it needs an internet connection; offline it shows a short notice.
- Is it free?
- Yes — free, no download, in your browser.
- Are these projections?
- No. The dataset carries both observed and projected columns, and this board deliberately uses only the observed one — the latest real estimate per country, currently 2023.
- Is median age the same as average age?
- No. The median is the midpoint of the age distribution, while the average adds all ages and divides by the population. The two can differ when the age profile is lopsided.
- Where do the estimates come from?
- From the UN Population Division’s World Population Prospects, which uses national censuses and surveys in a cohort-component model of fertility, mortality and migration.
- How often are these estimates updated?
- The UN publishes a new revision of World Population Prospects roughly every two to three years, and each revision can restate past estimates as new data arrives.