Bird Migration Map Screensaver
The Bird Migration Map screensaver plots recent verified migratory bird sightings on a world map, pulsing in live and key-less from GBIF, the global open biodiversity data network. It's free, runs in your browser, and ESC exits.
Live preview
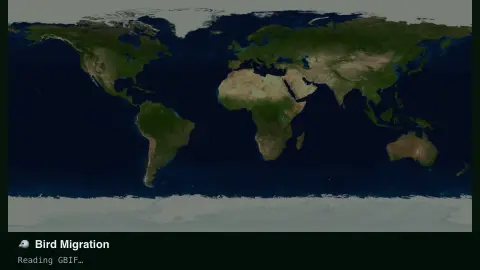
Press ESC to leave fullscreen. Settings are saved in your browser only.
How the Bird Migration Map screensaver works
The saver queries GBIF's occurrence API for the most recent verified bird records worldwide, with no key required.
Each sighting pulses onto a world map at its recorded coordinates, then fades as newer ones land.
A running tally counts sightings by the group you've chosen since you started watching.
Filter to waterfowl, raptors or songbirds, or leave it open to every migratory group.
Sightings, not trackers: how GBIF bird records work
GBIF, the Global Biodiversity Information Facility, is an international network and data infrastructure that aggregates biodiversity records from many publishers, including museums, universities, monitoring programmes and citizen-science projects such as the Cornell Lab of Ornithology’s eBird. A bird record is an occurrence: an organism recorded at a place and time, supplied by a data publisher and tagged with a basis of record such as human observation or machine observation.
Most of these records are observations made by people, not telemetry from tagged animals, although some come from sources such as sound recordings. Where dots cluster depends on where observers are active and how much of their data gets shared, so regions with many reporters look dense and regions with few look sparse. A blank area on the map usually means few shared reports, not an absence of birds.
Migration shows up only indirectly. As seasons change, a species’ sightings shift north or south, but any one dot is a single observation. GBIF crawls and processes each publisher’s dataset on its own schedule, so a record can appear well after the sighting. Publishers may also generalise coordinates, for instance to protect sensitive species. Treat the map as a sample of recent reporting activity, not the real-time position of a flock.
A worked example
Set it to Waterfowl during northern autumn and dots cluster along real flyways — the Atlantic and Mississippi corridors — each pulse a logged, verified sighting.
Settings & tips
- Species group narrows the map to one bird family.
- Accent recolours the pulse dots.
- Sighting density naturally follows real migration seasons.
Frequently asked questions
- Is this live GPS bird tracking?
- No — it plots verified occurrence records (birder and researcher sightings) from GBIF, refreshed continuously but not individual GPS-tagged birds.
- Is a key needed?
- No. GBIF's public API is free and key-less.
- Why does density change by season?
- It reflects real migration timing — more sightings cluster along active flyways during migration windows.
- Is it free?
- Yes — free, no download, in your browser.
- Does each dot show a bird currently in the air?
- No. It is the recorded location of a past observation, which might have been of a bird feeding or resting. GBIF aggregates occurrence records rather than live flight paths.
- Why are some regions nearly empty?
- Coverage follows observers and data sharing. Parts of the world with few birdwatchers or few published datasets contribute few records, whatever the true bird populations there.
- Can a location be inexact?
- Yes. Publishers can make shared data less specific than the original, for example by generalising coordinates for sensitive species, so a dot is not always a precise spot.